
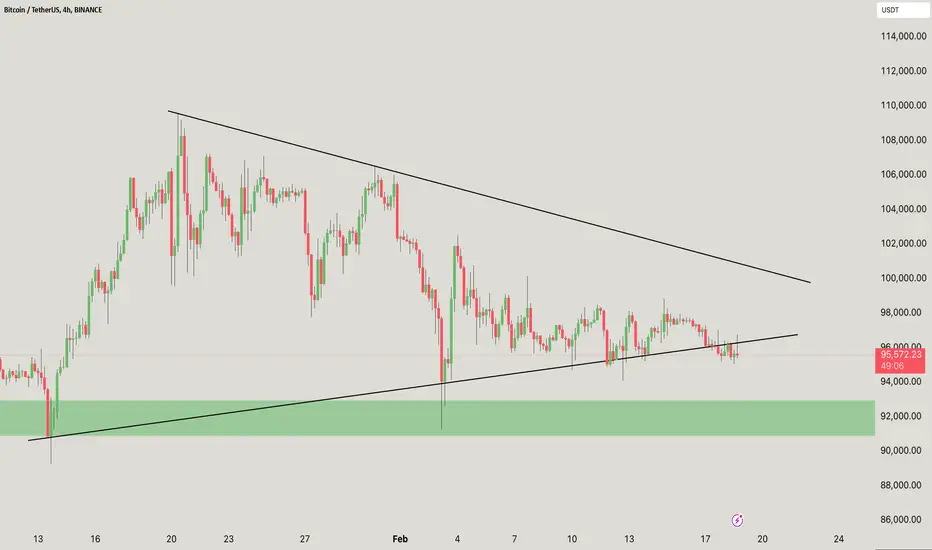
The BTC/USDT chart on the 4H timeframe shows a symmetrical triangle pattern, with price action near the top. Bitcoin is currently testing the lower trendline, a key support level. A breakdown below this level could lead to a decline towards the green demand zone of around $92,000. On the other hand, if BTC manages to hold the support and bounce back, it could attempt another test of the upper resistance trendline.
A decisive breakout in either direction will confirm the next trend. Keep an eye on increased volume to validate any breakout moves.
If you found this analysis helpful, hit the Like button and share your thoughts or questions in the comments below. Your feedback matters!
Thanks for your support!
DYOR. NFA

Verbundene Veröffentlichungen
Haftungsausschluss
Die Informationen und Veröffentlichungen sind nicht als Finanz-, Anlage-, Handels- oder andere Arten von Ratschlägen oder Empfehlungen gedacht, die von TradingView bereitgestellt oder gebilligt werden, und stellen diese nicht dar. Lesen Sie mehr in den Nutzungsbedingungen.