
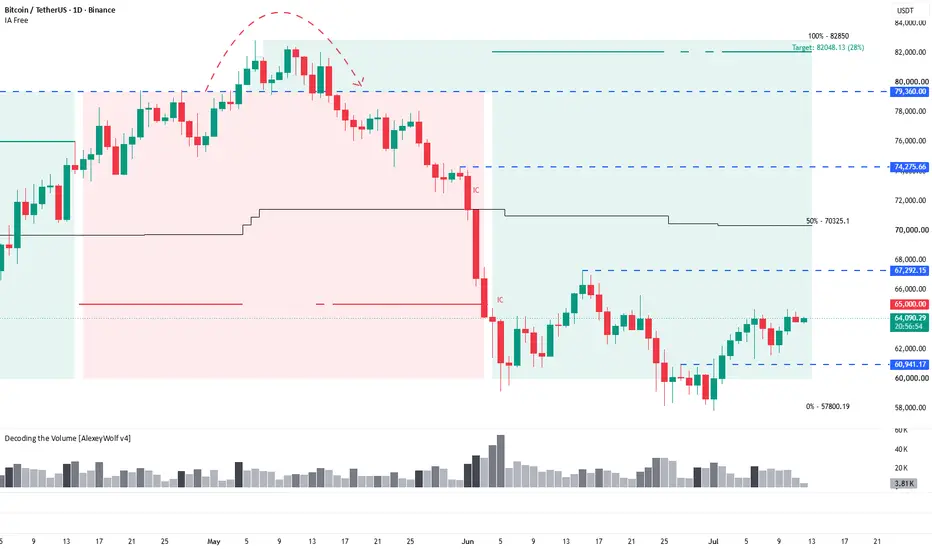
BTCUSDT remains in a sideways phase on the daily chart. The latest initiative belongs to buyers, but the current structure does not confirm a new uptrend yet.
The nearest support is 60,941.17. The closest resistance is 67,292.15 . As long as price stays between these levels, the market remains neutral. Acceptance above 67,292.15 would shift attention toward 70,325.1 and then 74,275.66. A loss of 60,941.17 would expose the lower range boundary at 57,800.19.
The active buyer target is 82,048.13, close to the upper boundary at 82,850. It is a structural objective, not confirmation that price will reach it. The 79,360.00 level also remains important resistance after a previous seller manipulation of the 79,360.00 level.
The key points to watch are buyer defense at 60,941.17 and acceptance above 67,232.15. Until then, this is a watch scenario rather than a trade signal.

BTCUSDT remains in a sideways phase on the 12-hour chart. The latest initiative belongs to buyers. The active buyer target is 65,622.83. Above it, the main resistance area is located between 67,292.15 and 67,516.00. This is the upper boundary of the range, where stronger seller reaction may appear.
The priority scenario is a move into the 65,622.83–67,516.00 range, where we need to watch for a seller reaction.
Profitable trades!
This analysis is based on the Initiative Analysis (IA) method.
The nearest support is 60,941.17. The closest resistance is 67,292.15 . As long as price stays between these levels, the market remains neutral. Acceptance above 67,292.15 would shift attention toward 70,325.1 and then 74,275.66. A loss of 60,941.17 would expose the lower range boundary at 57,800.19.
The active buyer target is 82,048.13, close to the upper boundary at 82,850. It is a structural objective, not confirmation that price will reach it. The 79,360.00 level also remains important resistance after a previous seller manipulation of the 79,360.00 level.
The key points to watch are buyer defense at 60,941.17 and acceptance above 67,232.15. Until then, this is a watch scenario rather than a trade signal.
BTCUSDT remains in a sideways phase on the 12-hour chart. The latest initiative belongs to buyers. The active buyer target is 65,622.83. Above it, the main resistance area is located between 67,292.15 and 67,516.00. This is the upper boundary of the range, where stronger seller reaction may appear.
The priority scenario is a move into the 65,622.83–67,516.00 range, where we need to watch for a seller reaction.
Profitable trades!
This analysis is based on the Initiative Analysis (IA) method.

Clarity on the Chart. Smart Trading Decisions
Haftungsausschluss
Die Informationen und Veröffentlichungen sind nicht als Finanz-, Anlage-, Handels- oder andere Arten von Ratschlägen oder Empfehlungen gedacht, die von TradingView bereitgestellt oder gebilligt werden, und stellen diese nicht dar. Lesen Sie mehr in den Nutzungsbedingungen.
Clarity on the Chart. Smart Trading Decisions
Haftungsausschluss
Die Informationen und Veröffentlichungen sind nicht als Finanz-, Anlage-, Handels- oder andere Arten von Ratschlägen oder Empfehlungen gedacht, die von TradingView bereitgestellt oder gebilligt werden, und stellen diese nicht dar. Lesen Sie mehr in den Nutzungsbedingungen.