
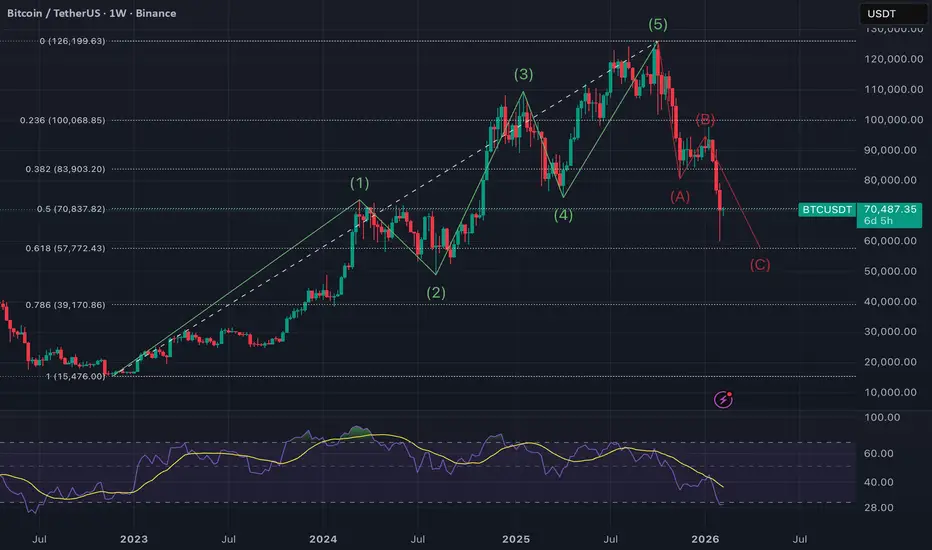
This idea presents a high-timeframe Elliott Wave analysis on BTC/USDT (1W), suggesting that Bitcoin has likely completed a full 5-wave impulsive cycle and is now unfolding a corrective ABC structure, with Wave C currently in progress.
The goal of this post is educational first: to illustrate how Elliott Wave Theory structures market cycles, while also integrating macro-economic and geopolitical factors that may influence Bitcoin price action in the coming months.
Elliott Wave Structure Explained
According to Elliott Wave Theory, markets move in fractal cycles:
On this chart:
Wave A: sharp impulsive decline
Wave B: corrective rebound (often deceptive and sentiment-driven)
Wave C: typically the strongest and most emotional leg, often matching or exceeding Wave A in magnitude
Current price action suggests BTC is developing Wave C, which historically aligns with:
Technical Confluence
Several technical elements support the Wave C hypothesis:
Wave C often seeks liquidity zones, prior consolidation ranges, or deeper Fibonacci retracements before a larger trend resumes.
Macro, Economic & Political Context
Beyond pure technicals, Bitcoin does not move in isolation. Current macro conditions that may amplify corrective pressure include:
These factors do not invalidate Bitcoin’s long-term thesis, but they align well with a corrective Wave C environment.
Important Notes
Corrections are not the end of a trend — they are the price paid for the next expansion.
Final Thought
Wave C is often where fear peaks and opportunity quietly forms. Whether this scenario plays out fully or partially, understanding where we are in the market cycle provides a strong strategic edge, especially on higher timeframes.
If you find this breakdown useful or educational, feel free to like, comment, or share your alternative counts — market structure thrives on discussion.
The goal of this post is educational first: to illustrate how Elliott Wave Theory structures market cycles, while also integrating macro-economic and geopolitical factors that may influence Bitcoin price action in the coming months.
Elliott Wave Structure Explained
According to Elliott Wave Theory, markets move in fractal cycles:
- 5 waves in the direction of the main trend (Impulse)
- 3 waves against the trend (Correction: A-B-C)
On this chart:
- Waves (1) to (5) form a clear impulsive advance
- Momentum divergence and structural exhaustion appear near the Wave (5) top
- The market then transitions into a corrective phase
Wave A: sharp impulsive decline
Wave B: corrective rebound (often deceptive and sentiment-driven)
Wave C: typically the strongest and most emotional leg, often matching or exceeding Wave A in magnitude
Current price action suggests BTC is developing Wave C, which historically aligns with:
- Increasing fear
- Negative narratives
- Macro uncertainty
- Liquidity tightening
Technical Confluence
Several technical elements support the Wave C hypothesis:
- Breakdown below key Fibonacci retracement levels
- Loss of prior macro support zones
- Weak momentum structure on higher timeframes
- RSI trending into bearish territory, consistent with corrective phases rather than impulsive rallies
Wave C often seeks liquidity zones, prior consolidation ranges, or deeper Fibonacci retracements before a larger trend resumes.
Macro, Economic & Political Context
Beyond pure technicals, Bitcoin does not move in isolation. Current macro conditions that may amplify corrective pressure include:
- Monetary policy uncertainty
High interest rates and delayed rate cuts reduce speculative liquidity, impacting risk assets like crypto. - USD strength vs global currencies
A strong dollar historically pressures BTC during corrective phases. - Geopolitical instability
Wars, trade tensions, and political polarization increase short-term volatility and risk aversion. - Regulatory pressure & narrative cycles
Regulatory uncertainty often peaks during market corrections — right when sentiment is weakest.
These factors do not invalidate Bitcoin’s long-term thesis, but they align well with a corrective Wave C environment.
Important Notes
- Elliott Wave counts are probabilistic, not absolute
- Alternative counts always exist
- This is not financial advice
- Always manage risk and confirm with your own tools
Corrections are not the end of a trend — they are the price paid for the next expansion.
Final Thought
Wave C is often where fear peaks and opportunity quietly forms. Whether this scenario plays out fully or partially, understanding where we are in the market cycle provides a strong strategic edge, especially on higher timeframes.
If you find this breakdown useful or educational, feel free to like, comment, or share your alternative counts — market structure thrives on discussion.
Trade geschlossen: Ziel wurde erreicht
Wave C ended at 57800$ (Fib 0.618) just 27$ diff from the level indicated on the graph!
Haftungsausschluss
Die Informationen und Veröffentlichungen sind nicht als Finanz-, Anlage-, Handels- oder andere Arten von Ratschlägen oder Empfehlungen gedacht, die von TradingView bereitgestellt oder gebilligt werden, und stellen diese nicht dar. Lesen Sie mehr in den Nutzungsbedingungen.
Haftungsausschluss
Die Informationen und Veröffentlichungen sind nicht als Finanz-, Anlage-, Handels- oder andere Arten von Ratschlägen oder Empfehlungen gedacht, die von TradingView bereitgestellt oder gebilligt werden, und stellen diese nicht dar. Lesen Sie mehr in den Nutzungsbedingungen.