
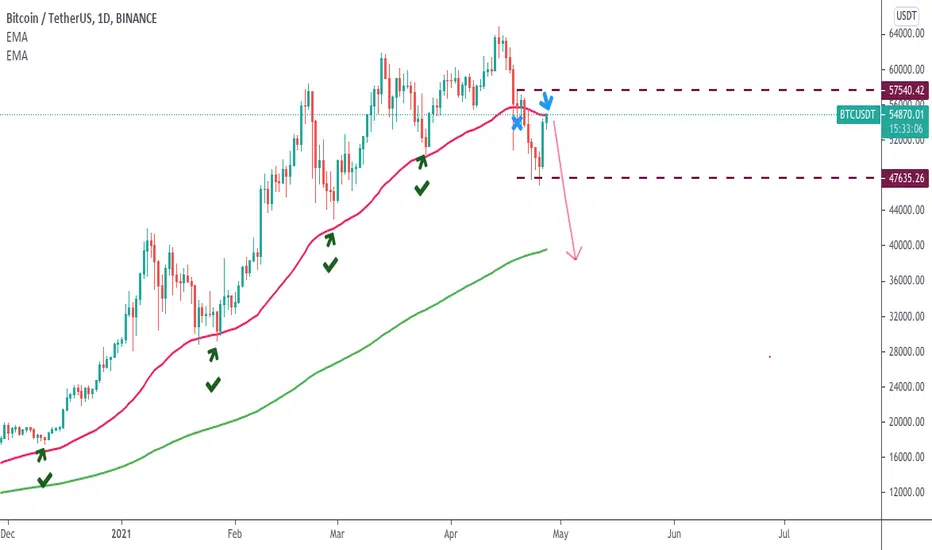
If we take a look at the moving averages on the market, it's clear that the 50DEMA was supportive (base-line) for the market until we reached the 64k top. After the initial crash the market drifted below the 50DMA (red line) then we had a pullback (retest). This could be a sign that from now the 50DEMA could act as a resistance instead of a support. But no worries, the 200DEMA is right there to save the bullish momentum. A lot of people sent me a few comments that the market is going up, this is one of the reason that I am shorting right now.
Trade ist aktiv
So far so good.
Verbundene Veröffentlichungen
Haftungsausschluss
Die Informationen und Veröffentlichungen sind nicht als Finanz-, Anlage-, Handels- oder andere Arten von Ratschlägen oder Empfehlungen gedacht, die von TradingView bereitgestellt oder gebilligt werden, und stellen diese nicht dar. Lesen Sie mehr in den Nutzungsbedingungen.
Verbundene Veröffentlichungen
Haftungsausschluss
Die Informationen und Veröffentlichungen sind nicht als Finanz-, Anlage-, Handels- oder andere Arten von Ratschlägen oder Empfehlungen gedacht, die von TradingView bereitgestellt oder gebilligt werden, und stellen diese nicht dar. Lesen Sie mehr in den Nutzungsbedingungen.