
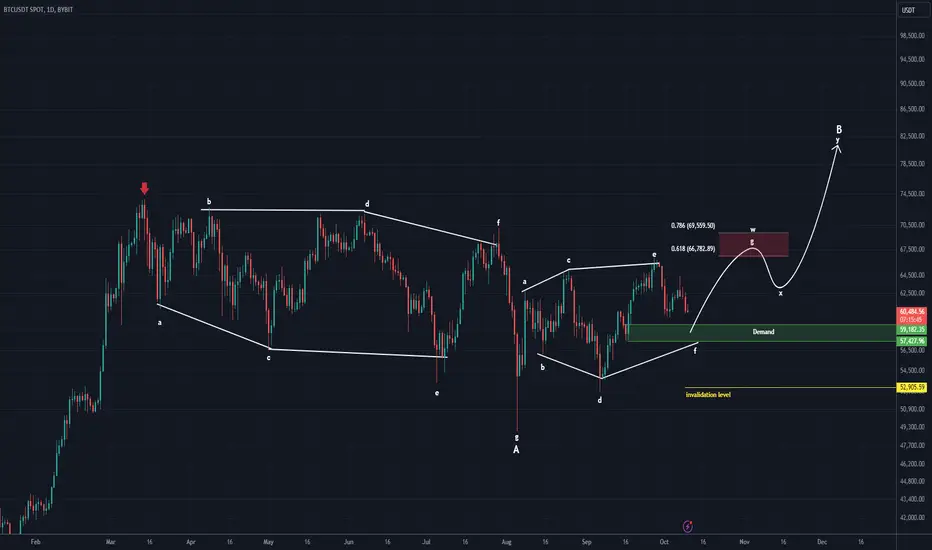
Bitcoin has shown signs and patterns in the daily time frame that can be analyzed with the current data.
It looks like a diametric has finished (A) and then the price has entered a bullish phase.
In the bullish phase, we have an ABC/WXY whose A/W has the signs of a diamond diametric.
We expect waves X and Y because the time of wave A is much larger than the current pattern (A/W).
The green range could be the start of a bull run in Bitcoin.
Closing a daily candle below the invalidation level will violate the analysis.
Note : This is only a possible scenario, please do not forget to manage risk
For risk management, please don't forget stop loss and capital management
Comment if you have any questions
Thank You
Trade ist aktiv
Description is very important (read) :Bitcoin has now reached the red zone.
Bitcoin can pump up to 72K and then arrange its median correction. (from 67k to 72k is the supply range).
After a correction towards 55800-52800, it can attack towards 80k areas.
For now, we have this view.
Anmerkung
We correct these numbers:After a correction towards 64500 - 62800, it can attack towards 80k areas.
Trade geschlossen: Ziel wurde erreicht
This Bitcoin move was well done
🔥 Don't Just Watch the Market. Understand It!
📊 Crypto Analysis & Setups:
👉 t.me/Behdark_EN
💹 Forex Analysis & Setups:
👉 t.me/FX_Behdark
🚀 Join BehDark for Market Insights, Trading Setups & Key Levels. Choose Your Market & Join Us!
📊 Crypto Analysis & Setups:
👉 t.me/Behdark_EN
💹 Forex Analysis & Setups:
👉 t.me/FX_Behdark
🚀 Join BehDark for Market Insights, Trading Setups & Key Levels. Choose Your Market & Join Us!
Haftungsausschluss
Die Informationen und Veröffentlichungen sind nicht als Finanz-, Anlage-, Handels- oder andere Arten von Ratschlägen oder Empfehlungen gedacht, die von TradingView bereitgestellt oder gebilligt werden, und stellen diese nicht dar. Lesen Sie mehr in den Nutzungsbedingungen.