
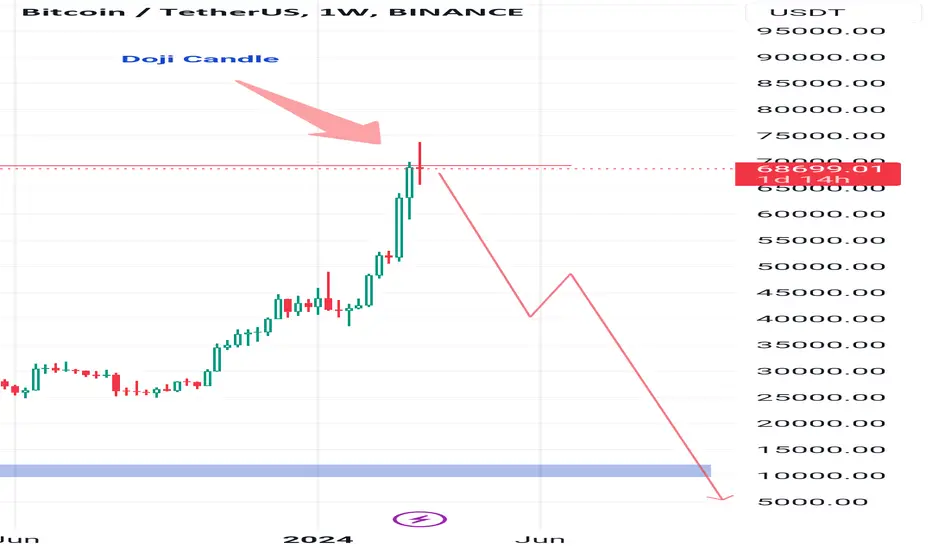
Supply Zone:
A supply zone occurs when the supply of a cryptocurrency exceeds the demand.
In this area, there is excess supply, leading to a falling price.
On a price chart, a supply zone is associated with a downtrend.
Traders often place sell orders in supply zones, expecting prices to decline further.
Imp : forming doji candles in weekly chart
Interpreting Doji Patterns:
Bearish Doji: When a Doji forms at a resistance area, it can signal indecision or a potential trend reversal.
However, the context matters:
If the preceding trend is upward, a bearish Doji may indicate a reversal.
If the preceding trend is downward, it could reinforce the existing bearish sentiment.
A supply zone occurs when the supply of a cryptocurrency exceeds the demand.
In this area, there is excess supply, leading to a falling price.
On a price chart, a supply zone is associated with a downtrend.
Traders often place sell orders in supply zones, expecting prices to decline further.
Imp : forming doji candles in weekly chart
Interpreting Doji Patterns:
Bearish Doji: When a Doji forms at a resistance area, it can signal indecision or a potential trend reversal.
However, the context matters:
If the preceding trend is upward, a bearish Doji may indicate a reversal.
If the preceding trend is downward, it could reinforce the existing bearish sentiment.

Haftungsausschluss
Die Informationen und Veröffentlichungen sind nicht als Finanz-, Anlage-, Handels- oder andere Arten von Ratschlägen oder Empfehlungen gedacht, die von TradingView bereitgestellt oder gebilligt werden, und stellen diese nicht dar. Lesen Sie mehr in den Nutzungsbedingungen.
Haftungsausschluss
Die Informationen und Veröffentlichungen sind nicht als Finanz-, Anlage-, Handels- oder andere Arten von Ratschlägen oder Empfehlungen gedacht, die von TradingView bereitgestellt oder gebilligt werden, und stellen diese nicht dar. Lesen Sie mehr in den Nutzungsbedingungen.