
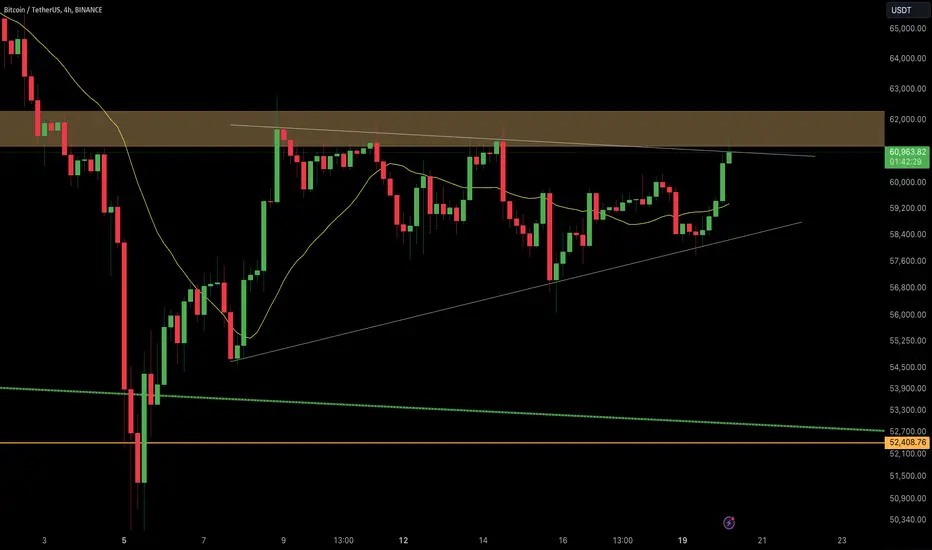
BTC/USDT is testing a crucial resistance zone around $61,400 – $62,000 within an ascending triangle pattern. A successful breakout above this level could lead to a continuation of the uptrend. However, if the price fails to break out, a return to support levels around $58,400 or $52,408 could occur. Traders should monitor volume for confirmation of any breakout.
BTC/USDT 4-hour chart, focusing on key support and resistance levels, moving averages, and chart patterns.
Remember: This is not financial advice. Stay tuned to us for further updates and analysis. Thank you!
BTC/USDT 4-hour chart, focusing on key support and resistance levels, moving averages, and chart patterns.
Remember: This is not financial advice. Stay tuned to us for further updates and analysis. Thank you!

Verbundene Veröffentlichungen
Haftungsausschluss
Die Informationen und Veröffentlichungen sind nicht als Finanz-, Anlage-, Handels- oder andere Arten von Ratschlägen oder Empfehlungen gedacht, die von TradingView bereitgestellt oder gebilligt werden, und stellen diese nicht dar. Lesen Sie mehr in den Nutzungsbedingungen.
Verbundene Veröffentlichungen
Haftungsausschluss
Die Informationen und Veröffentlichungen sind nicht als Finanz-, Anlage-, Handels- oder andere Arten von Ratschlägen oder Empfehlungen gedacht, die von TradingView bereitgestellt oder gebilligt werden, und stellen diese nicht dar. Lesen Sie mehr in den Nutzungsbedingungen.