
In this daily analysis of Bitcoin (BTC/USDT), we take a look at the current price action relative to key trend indicators and key resistance zones.
Key Technical Factors:
SuperTrend Indicator:
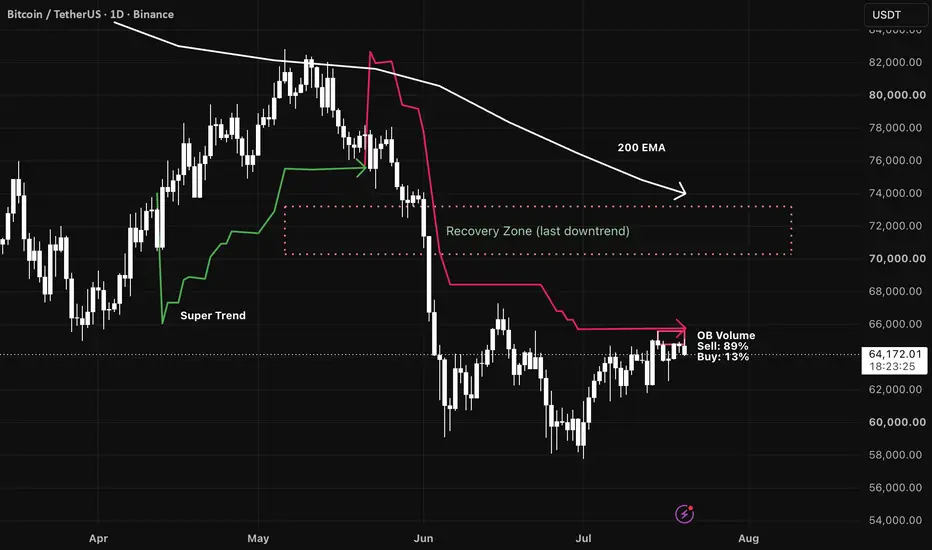
The SuperTrend flipped bearish in late May/early June after the strong drop from the $70k+ levels. The red trailing stop level currently sits around $66,000, acting as immediate dynamic resistance.
Order Book Volume Ratio (OB Volume):
At the current level, sell volume dominance is showing around 89% vs. 13% buy volume, highlighting significant selling pressure right near this dynamic SuperTrend resistance.
Recovery Zone (70k – 73k):
If BTC manages to break and hold above the current red SuperTrend line (~$66,000), the next major target area lies within the Recovery Zone ($70,000 – $73,000), which corresponds to the base of the previous major breakdown.
200 EMA:
The 200-day Exponential Moving Average is currently sloping downward above the price, adding a layer of long-term dynamic resistance above the 73k mark.
Scenario Breakdown:
Bearish / Rejection Scenario:
As long as price remains capped under the $66,000 SuperTrend line and heavy selling volume persists, a rejection back toward local support levels ($60,000 – $58,000) remains a strong possibility.
Bullish Confirmation:
A daily candle close above $66,000 would invalidate the short-term bearish SuperTrend and open up a potential move toward the $70,000 – $73,000 Recovery Zone.
Disclaimer: This analysis is for educational purposes only and does not constitute financial advice. Always manage your risk according to your trading strategy.
Key Technical Factors:
SuperTrend Indicator:
The SuperTrend flipped bearish in late May/early June after the strong drop from the $70k+ levels. The red trailing stop level currently sits around $66,000, acting as immediate dynamic resistance.
Order Book Volume Ratio (OB Volume):
At the current level, sell volume dominance is showing around 89% vs. 13% buy volume, highlighting significant selling pressure right near this dynamic SuperTrend resistance.
Recovery Zone (70k – 73k):
If BTC manages to break and hold above the current red SuperTrend line (~$66,000), the next major target area lies within the Recovery Zone ($70,000 – $73,000), which corresponds to the base of the previous major breakdown.
200 EMA:
The 200-day Exponential Moving Average is currently sloping downward above the price, adding a layer of long-term dynamic resistance above the 73k mark.
Scenario Breakdown:
Bearish / Rejection Scenario:
As long as price remains capped under the $66,000 SuperTrend line and heavy selling volume persists, a rejection back toward local support levels ($60,000 – $58,000) remains a strong possibility.
Bullish Confirmation:
A daily candle close above $66,000 would invalidate the short-term bearish SuperTrend and open up a potential move toward the $70,000 – $73,000 Recovery Zone.
Disclaimer: This analysis is for educational purposes only and does not constitute financial advice. Always manage your risk according to your trading strategy.

CH Invest and Trading
Haftungsausschluss
Die Informationen und Veröffentlichungen sind nicht als Finanz-, Anlage-, Handels- oder andere Arten von Ratschlägen oder Empfehlungen gedacht, die von TradingView bereitgestellt oder gebilligt werden, und stellen diese nicht dar. Lesen Sie mehr in den Nutzungsbedingungen.
CH Invest and Trading
Haftungsausschluss
Die Informationen und Veröffentlichungen sind nicht als Finanz-, Anlage-, Handels- oder andere Arten von Ratschlägen oder Empfehlungen gedacht, die von TradingView bereitgestellt oder gebilligt werden, und stellen diese nicht dar. Lesen Sie mehr in den Nutzungsbedingungen.