
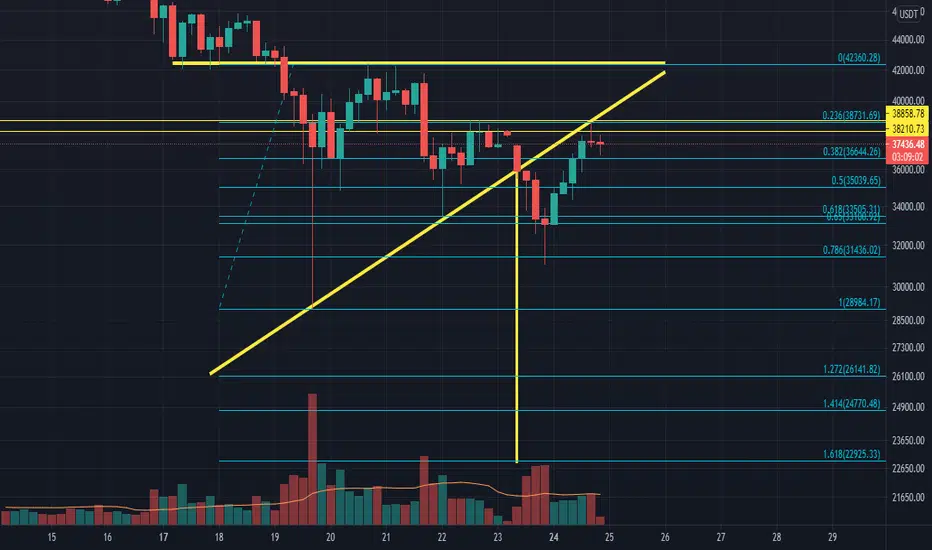
This is a very lenient chart analysis of BTC (I would say) where I have made ascending triangle by joining wick to wick.
Although, BTCUSDT broke out in the downward direction yesterday and successfully bounced out from 61.8% Fibonacci golden ratio to retest the previous support as resistance. Currently, BTC is in the retest phase and is facing a resistance of $38000.
According to my technical analysis, if BTCUSDT comes down and breakdown the previous low of about $31000, it can go up to a 1.618 golden ratio that values around $22900. And yes, from the previous BTC price action, we know it has strong support at around $23000.
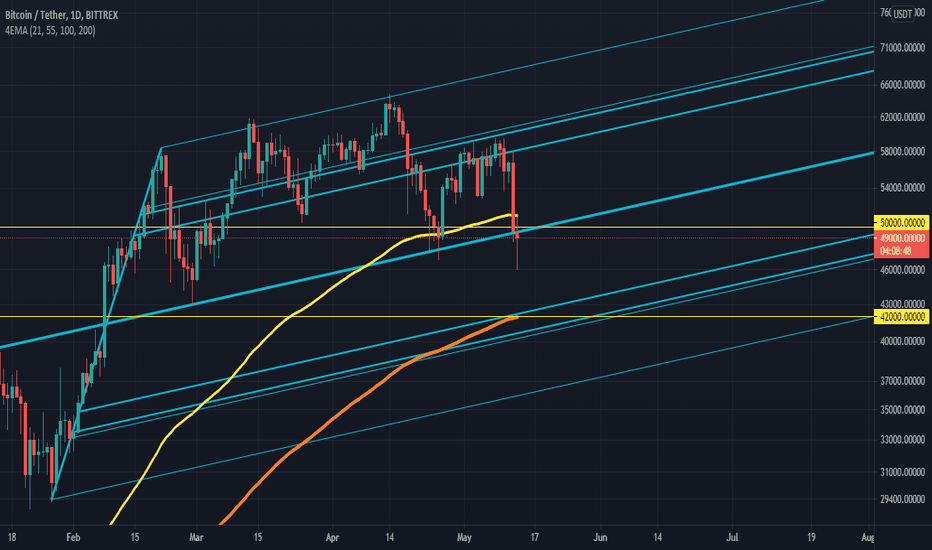
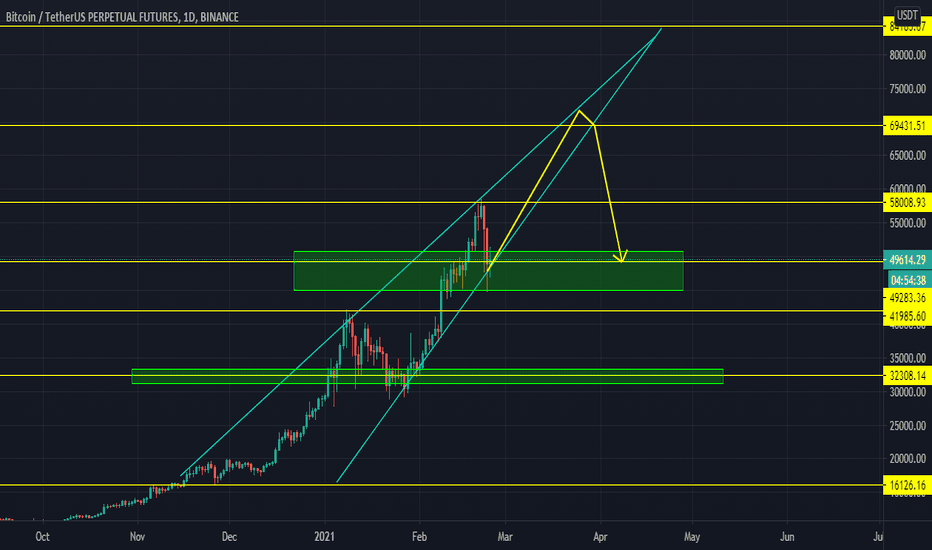
Just to remind you, I made multiple predictions for BTC when everyone around was shouting of BTC at $100k!
Here is my analysis on BTC when it was at $50000 giving a short signal, if some of you followed it, you're probably in 40% profit!

Comment in your thoughts & queries.
Muneeb

Verbundene Veröffentlichungen
Haftungsausschluss
Die Informationen und Veröffentlichungen sind nicht als Finanz-, Anlage-, Handels- oder andere Arten von Ratschlägen oder Empfehlungen gedacht, die von TradingView bereitgestellt oder gebilligt werden, und stellen diese nicht dar. Lesen Sie mehr in den Nutzungsbedingungen.
Verbundene Veröffentlichungen
Haftungsausschluss
Die Informationen und Veröffentlichungen sind nicht als Finanz-, Anlage-, Handels- oder andere Arten von Ratschlägen oder Empfehlungen gedacht, die von TradingView bereitgestellt oder gebilligt werden, und stellen diese nicht dar. Lesen Sie mehr in den Nutzungsbedingungen.