Long
Cannabiscoin feuling up
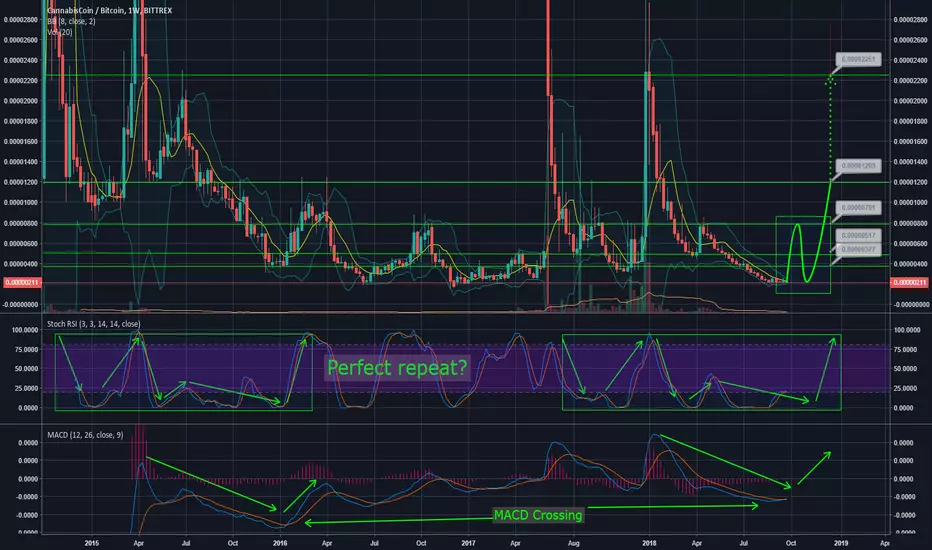
Just started looking at the weekly view and found a repeating pattern in the YTD chart of CANN.
Indicators
Fact
Chart is weekly view, have to give this trade some time to develop.
My Targets:
Mid term
- 377 Sat
- 517 Sat
- 791 Sat
When we look at the history of this coin, big pumps happen, targets (risky) here are:
- 1203
- 2270
- Up to 4500
This is no advice, just my tradesetup an why! DYOR and good luck!
Indicators
- MACD is rising and ready to cross on the weekly chart.
- RSI is making a repeating move to, you can see the repeating pattern in the green rectangles.
Fact
Chart is weekly view, have to give this trade some time to develop.
My Targets:
Mid term
- 377 Sat
- 517 Sat
- 791 Sat
When we look at the history of this coin, big pumps happen, targets (risky) here are:
- 1203
- 2270
- Up to 4500
This is no advice, just my tradesetup an why! DYOR and good luck!

Haftungsausschluss
Die Informationen und Veröffentlichungen sind nicht als Finanz-, Anlage-, Handels- oder andere Arten von Ratschlägen oder Empfehlungen gedacht, die von TradingView bereitgestellt oder gebilligt werden, und stellen diese nicht dar. Lesen Sie mehr in den Nutzungsbedingungen.
Haftungsausschluss
Die Informationen und Veröffentlichungen sind nicht als Finanz-, Anlage-, Handels- oder andere Arten von Ratschlägen oder Empfehlungen gedacht, die von TradingView bereitgestellt oder gebilligt werden, und stellen diese nicht dar. Lesen Sie mehr in den Nutzungsbedingungen.