
NASDAQ: CEG — Strong Rebound from Support, Uptrend Still Intact?
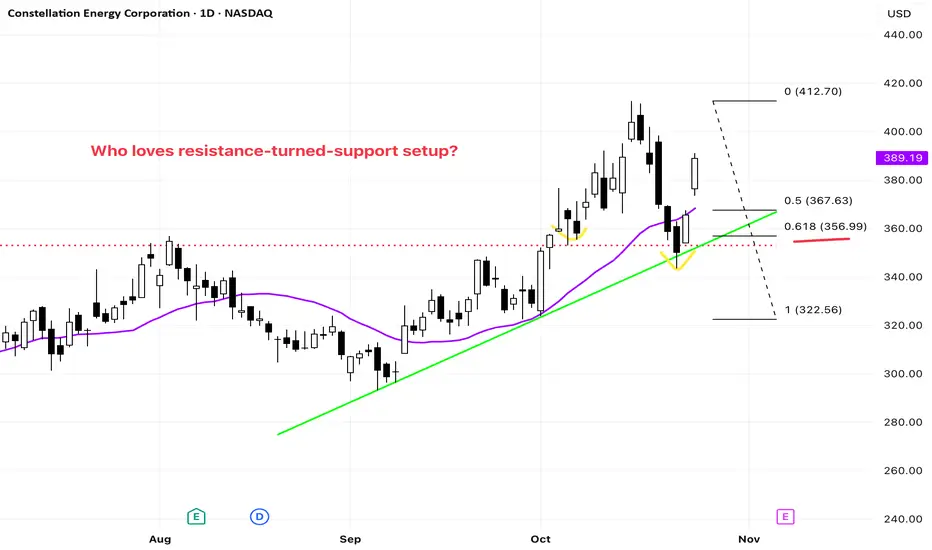
On the daily chart, CEG found solid support and began to rebound.
The September price action shows a clear higher high, higher low structure — confirming a healthy uptrend. The upward trendline (green) continues to act as reliable dynamic support.
In October, the stock broke above the previous horizontal resistance (red dotted line), and recent pullbacks have retested the same level as support — a classic resistance-turned-support setup.
After a successful retest of the horizontal support line — which coincides with the Fibonacci 0.618 retracement zone — the latest candle closed back above the 20-day SMA (purple), reaffirming that the uptrend remains firmly intact.
Friday’s session showed strong momentum with a gap-up and a full-bodied bullish candle, signaling renewed buying interest.
Overall, the uptrend remains valid, and this rebound from support may mark the beginning of the next leg higher.
The September price action shows a clear higher high, higher low structure — confirming a healthy uptrend. The upward trendline (green) continues to act as reliable dynamic support.
In October, the stock broke above the previous horizontal resistance (red dotted line), and recent pullbacks have retested the same level as support — a classic resistance-turned-support setup.
After a successful retest of the horizontal support line — which coincides with the Fibonacci 0.618 retracement zone — the latest candle closed back above the 20-day SMA (purple), reaffirming that the uptrend remains firmly intact.
Friday’s session showed strong momentum with a gap-up and a full-bodied bullish candle, signaling renewed buying interest.
Overall, the uptrend remains valid, and this rebound from support may mark the beginning of the next leg higher.

Haftungsausschluss
Die Informationen und Veröffentlichungen sind nicht als Finanz-, Anlage-, Handels- oder andere Arten von Ratschlägen oder Empfehlungen gedacht, die von TradingView bereitgestellt oder gebilligt werden, und stellen diese nicht dar. Lesen Sie mehr in den Nutzungsbedingungen.
Haftungsausschluss
Die Informationen und Veröffentlichungen sind nicht als Finanz-, Anlage-, Handels- oder andere Arten von Ratschlägen oder Empfehlungen gedacht, die von TradingView bereitgestellt oder gebilligt werden, und stellen diese nicht dar. Lesen Sie mehr in den Nutzungsbedingungen.