Long
CEI
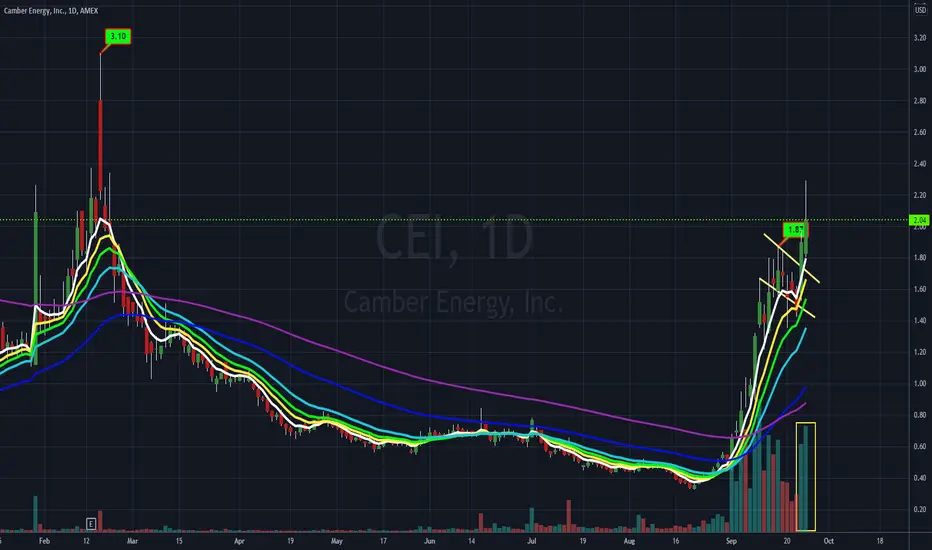
Camber Energy Inc (NYSEAMERICAN:CEI) broke through resistance and out of a small bullish flag formation last week. The technical daily chart above shows very strong upward momentum as the stock is above all the major moving averages with both 50-day EMA and 200-day exp moving averages going up. All indicators still point to a bull market. The next level to watch is Friday's high of 2.29, followed by 2.80. Support awaits at 1.81, a low point on Friday, followed by 1.70, which provided support on Thursday (EMA50). With the trend still up the bias is to the upside.

Haftungsausschluss
Die Informationen und Veröffentlichungen sind nicht als Finanz-, Anlage-, Handels- oder andere Arten von Ratschlägen oder Empfehlungen gedacht, die von TradingView bereitgestellt oder gebilligt werden, und stellen diese nicht dar. Lesen Sie mehr in den Nutzungsbedingungen.
Haftungsausschluss
Die Informationen und Veröffentlichungen sind nicht als Finanz-, Anlage-, Handels- oder andere Arten von Ratschlägen oder Empfehlungen gedacht, die von TradingView bereitgestellt oder gebilligt werden, und stellen diese nicht dar. Lesen Sie mehr in den Nutzungsbedingungen.