
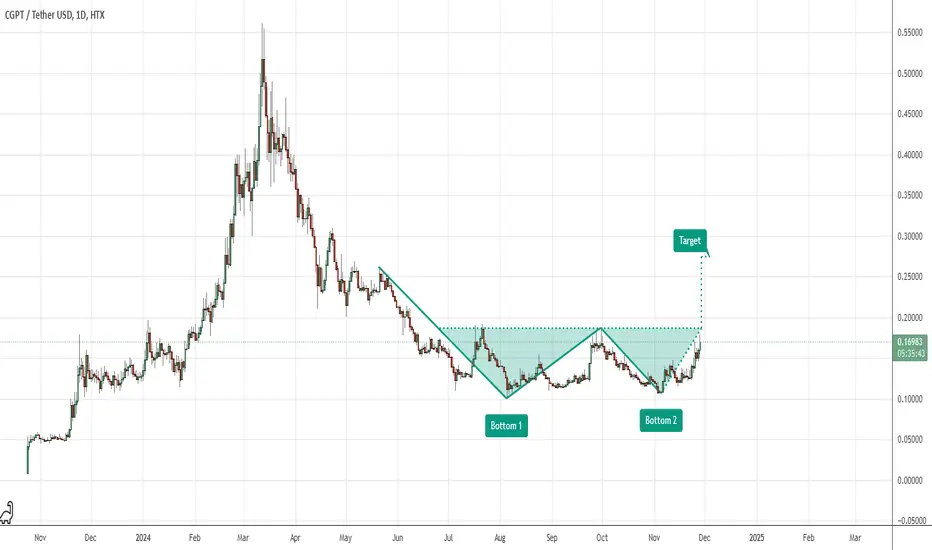
The chart depicts a double-bottom pattern, signaling a potential bullish reversal. The breakout above the neckline (~$0.17) confirms the pattern, with a target projected near $0.30 based on the height of the formation. Strong support lies at $0.15, while resistance levels exist around $0.22 and $0.25. Sustained momentum could achieve the target.

Haftungsausschluss
Die Informationen und Veröffentlichungen sind nicht als Finanz-, Anlage-, Handels- oder andere Arten von Ratschlägen oder Empfehlungen gedacht, die von TradingView bereitgestellt oder gebilligt werden, und stellen diese nicht dar. Lesen Sie mehr in den Nutzungsbedingungen.
Haftungsausschluss
Die Informationen und Veröffentlichungen sind nicht als Finanz-, Anlage-, Handels- oder andere Arten von Ratschlägen oder Empfehlungen gedacht, die von TradingView bereitgestellt oder gebilligt werden, und stellen diese nicht dar. Lesen Sie mehr in den Nutzungsbedingungen.