
This is a bit of a scrappy chart, but I still see the potential for a cheeky bounce.
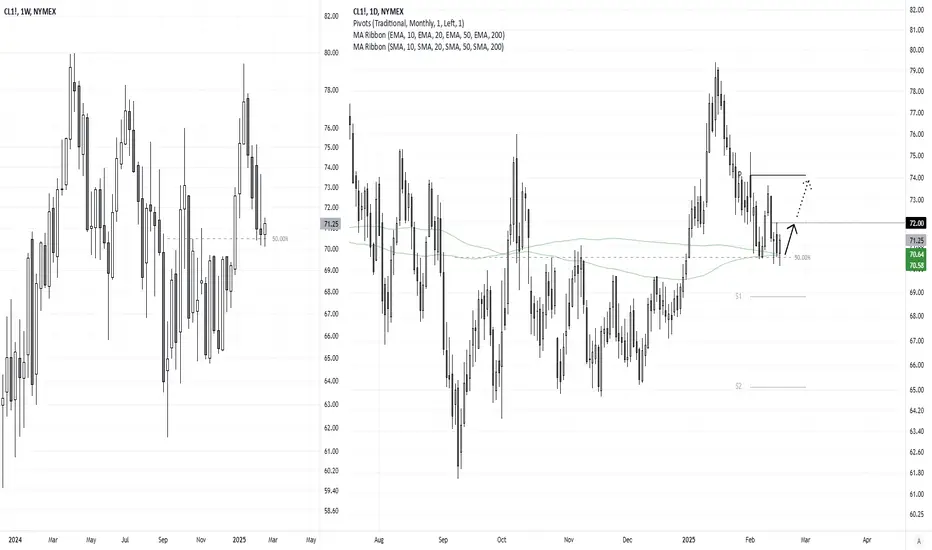
WTI crude oil is trying to snap a 4-week losing streak, by stalling around a 50% retracement level. Last week's candle was an inverted hammer, and the previous two weeks have both closed above the 50% level.
A bullish divergence formed on the daily RSI (2) ahead price action finding support at the 200-day SMA and 200-day EMA.
From here, the bias remains bullish while prices hold above last week's low. Bulls could seek dips towards the 200-day MAs, with a near-term upside target of $72. A break above which brings $74 into focus, near the monthly pivot point.
Matt Simpson, Market Analyst at City Index and Forex.com
WTI crude oil is trying to snap a 4-week losing streak, by stalling around a 50% retracement level. Last week's candle was an inverted hammer, and the previous two weeks have both closed above the 50% level.
A bullish divergence formed on the daily RSI (2) ahead price action finding support at the 200-day SMA and 200-day EMA.
From here, the bias remains bullish while prices hold above last week's low. Bulls could seek dips towards the 200-day MAs, with a near-term upside target of $72. A break above which brings $74 into focus, near the monthly pivot point.
Matt Simpson, Market Analyst at City Index and Forex.com
Trade geschlossen: Ziel wurde erreicht

Verbundene Veröffentlichungen
Haftungsausschluss
Die Informationen und Veröffentlichungen sind nicht als Finanz-, Anlage-, Handels- oder andere Arten von Ratschlägen oder Empfehlungen gedacht, die von TradingView bereitgestellt oder gebilligt werden, und stellen diese nicht dar. Lesen Sie mehr in den Nutzungsbedingungen.
Verbundene Veröffentlichungen
Haftungsausschluss
Die Informationen und Veröffentlichungen sind nicht als Finanz-, Anlage-, Handels- oder andere Arten von Ratschlägen oder Empfehlungen gedacht, die von TradingView bereitgestellt oder gebilligt werden, und stellen diese nicht dar. Lesen Sie mehr in den Nutzungsbedingungen.