
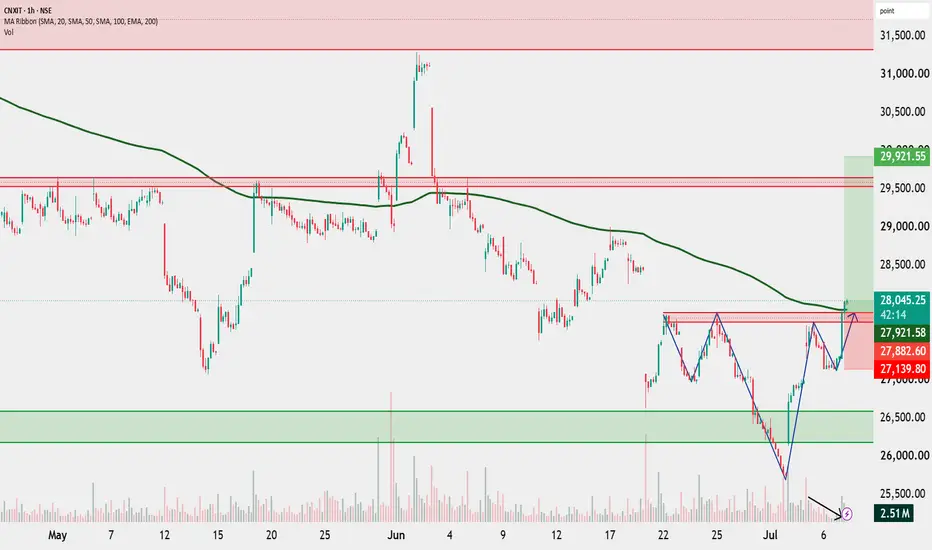
CNX IT is forming an Inverse Head and Shoulder pattern while also showing a bullish market structure with higher highs and higher lows after a Change of Character (ChoCH). Price is testing the neckline and the 200 EMA, making this a crucial resistance zone. A sustained close above 27,900–28,000 would confirm a Break of Structure (BOS) and strengthen the bullish outlook. Volume has declined during the pullback, indicating weak selling pressure. Wait for a confirmed breakout before taking any position.
Disclaimer: For educational purposes only. Not an investment recommendation. Please consult your registered financial advisor. I am only a SEBI Certified Research Analyst.
Disclaimer: For educational purposes only. Not an investment recommendation. Please consult your registered financial advisor. I am only a SEBI Certified Research Analyst.

Verbundene Veröffentlichungen
Haftungsausschluss
Die Informationen und Veröffentlichungen sind nicht als Finanz-, Anlage-, Handels- oder andere Arten von Ratschlägen oder Empfehlungen gedacht, die von TradingView bereitgestellt oder gebilligt werden, und stellen diese nicht dar. Lesen Sie mehr in den Nutzungsbedingungen.
Verbundene Veröffentlichungen
Haftungsausschluss
Die Informationen und Veröffentlichungen sind nicht als Finanz-, Anlage-, Handels- oder andere Arten von Ratschlägen oder Empfehlungen gedacht, die von TradingView bereitgestellt oder gebilligt werden, und stellen diese nicht dar. Lesen Sie mehr in den Nutzungsbedingungen.