
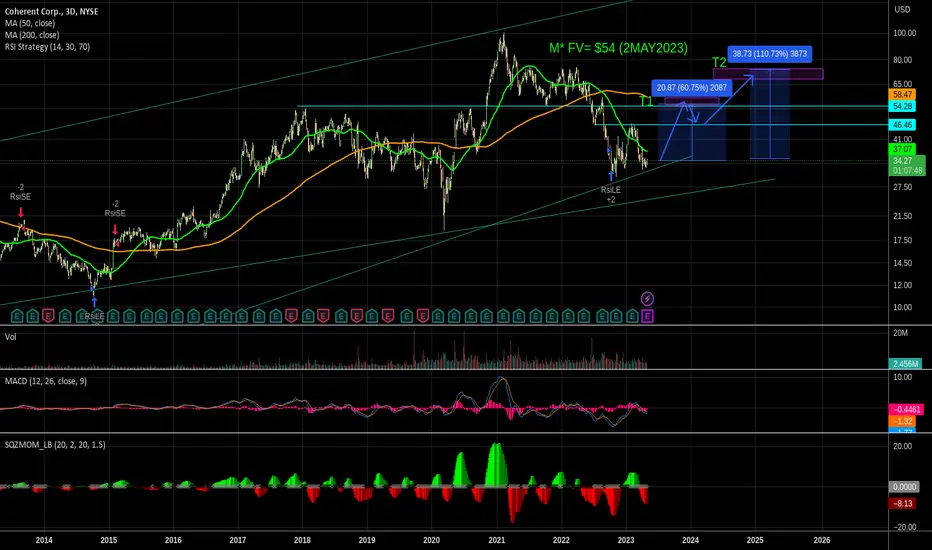
COHR caught my attention for a few reasons.
1st. It is ≈11% of total holding of Scion Asset Mngt holdings, one of the best performing funds since 2008.
2. Technical: SP trading in demand zone, appearing to possibly be in process of forming a double bottom- confirmed on 3 day rule, vol, etc. passing 46.46 area.
3. Valuation: Currently at steep discount to competitors despite continual growth in earnings. significantly below sector by almost every metric... EV/EBITDA TTM 16% below; FWD- 40% below, P/S TTM/ FWD- 63/65% respectively, Price/ CF- 79% below. Trading about 50% below 5 year PB and 55% 5 year P/Cash flow.
4. Growth: Rev Growth YoY 177% above sector; FWD-116% above sector, significantly above sector by almost every metric besides ROE.
1st. It is ≈11% of total holding of Scion Asset Mngt holdings, one of the best performing funds since 2008.
2. Technical: SP trading in demand zone, appearing to possibly be in process of forming a double bottom- confirmed on 3 day rule, vol, etc. passing 46.46 area.
3. Valuation: Currently at steep discount to competitors despite continual growth in earnings. significantly below sector by almost every metric... EV/EBITDA TTM 16% below; FWD- 40% below, P/S TTM/ FWD- 63/65% respectively, Price/ CF- 79% below. Trading about 50% below 5 year PB and 55% 5 year P/Cash flow.
4. Growth: Rev Growth YoY 177% above sector; FWD-116% above sector, significantly above sector by almost every metric besides ROE.

Haftungsausschluss
Die Informationen und Veröffentlichungen sind nicht als Finanz-, Anlage-, Handels- oder andere Arten von Ratschlägen oder Empfehlungen gedacht, die von TradingView bereitgestellt oder gebilligt werden, und stellen diese nicht dar. Lesen Sie mehr in den Nutzungsbedingungen.
Haftungsausschluss
Die Informationen und Veröffentlichungen sind nicht als Finanz-, Anlage-, Handels- oder andere Arten von Ratschlägen oder Empfehlungen gedacht, die von TradingView bereitgestellt oder gebilligt werden, und stellen diese nicht dar. Lesen Sie mehr in den Nutzungsbedingungen.