
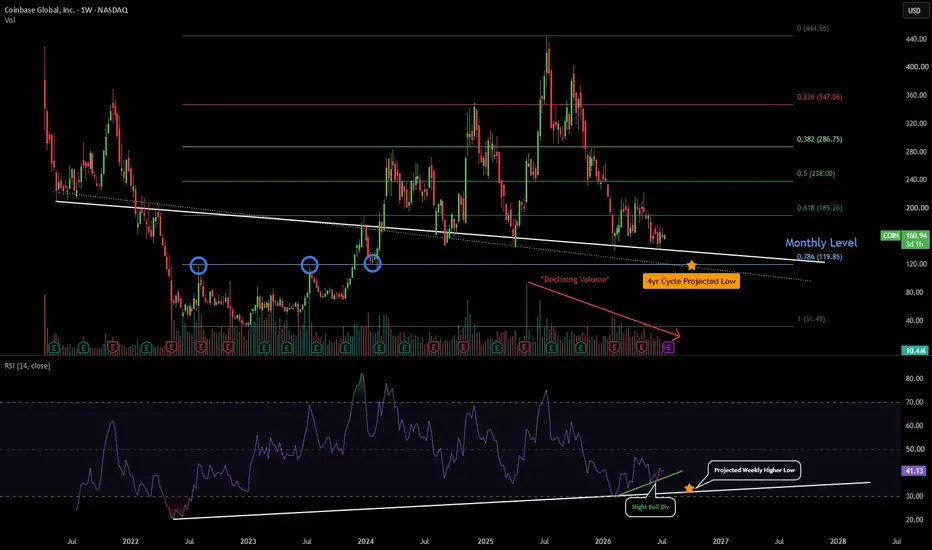
Right now COIN is at extremely important structural levels. The market structure that matters most is on the weekly timeframe. In this idea I will lay out the current daily outlook, what to expect going forward, and when/where Coinbase will likely bottom for this cycle.
The Daily Timeframe

In this chart, I laid out everything important to examine on the daily chart right now.
First, the two major support levels that have marked lows since August 2024. The green line is the lower range around $146 and the blue line is the upper range around $160. Keep both of these in mind as I have been tracking these levels across several previous ideas linked later in this post.
The next thing to look at is the RSI. Bulls have done a very good job showing demand and flipping trend momentum every time the daily RSI dips below 35 toward oversold conditions (marked by the green circles). Right now price has just bounced and cleared the blue line, which looks very encouraging on the daily chart, accompanied by a slight bullish divergence that has also formed.
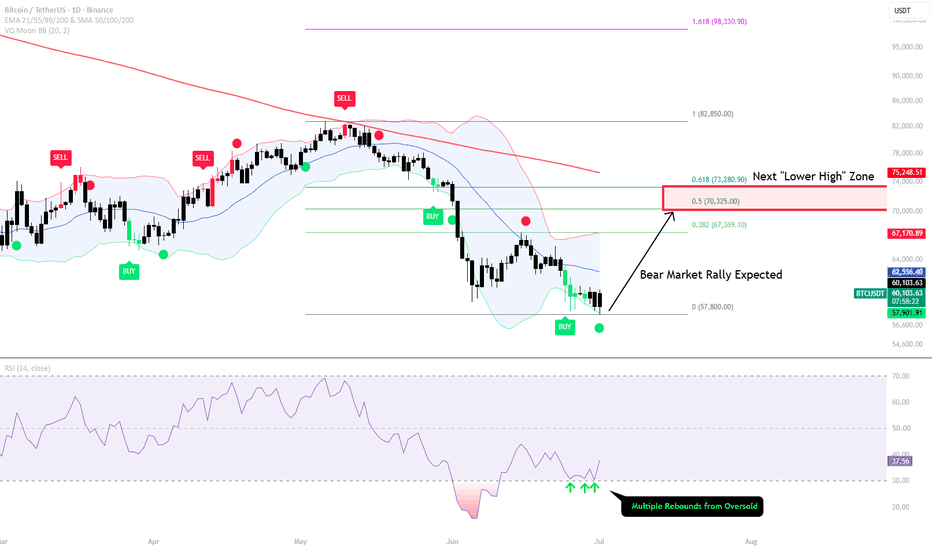
From a daily perspective I would expect a move toward the LTF golden zone, which would likely align with BTC reaching back into the $70,000 range, as outlined in these related ideas:

The Weekly Timeframe
As stated, the weekly is the most important structure to examine. To begin, it is worth revisiting some of my past ideas, since the level price just bounced from is one I have been outlining for quite some time:
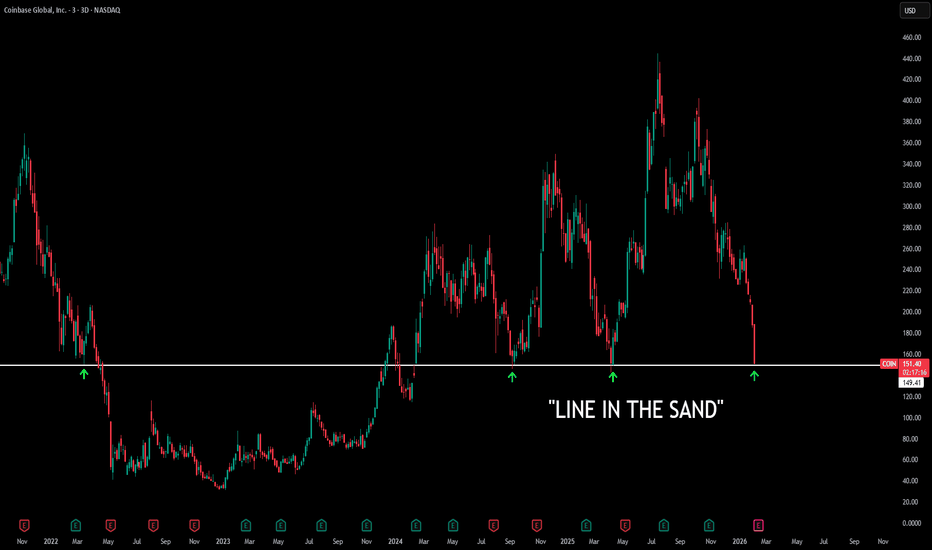

I had these levels outlined as the "Line in the Sand" and "Breakdown Target 2."
Now that more market structure has developed, the future path for price action is becoming clearer. There are many signs that COIN is getting close to a market cycle bottom, but it appears one more drop needs to occur before that bottom can be fully solidified.
My Updated Chart
On my updated chart I have added two white lines, one solid and one dotted, each angled differently but both structurally significant.
My hypothesis is that COIN will bottom somewhere around the 0.786 Fibonacci level and the dotted white trendline near early October 2026. If/when that occurs, I would also project a higher low forming on the weekly RSI somewhere around the white trendline in October.
It is difficult to say exactly where that low will land, but I would be eyeing the $110 to $120 range. As time and price get closer to this projection, I will be able to more precisely identify where the exact bottom is likely to occur.
To summarize, the lower timeframes look bullish for a move back to the upside in the near term. But looking further out toward Q4, one more drop is likely to sweep all the liquidity below the market structure that has been established over the past two years, ultimately creating the market cycle bottom.
This is also highly probable given that on the weekly timeframe, volume has continued declining with every bounce. Around the time of my October projection is when Coinbase will likely see a massive influx of volume return.
Only time will tell, but this is an early roadmap for what to expect.
The Daily Timeframe
In this chart, I laid out everything important to examine on the daily chart right now.
First, the two major support levels that have marked lows since August 2024. The green line is the lower range around $146 and the blue line is the upper range around $160. Keep both of these in mind as I have been tracking these levels across several previous ideas linked later in this post.
The next thing to look at is the RSI. Bulls have done a very good job showing demand and flipping trend momentum every time the daily RSI dips below 35 toward oversold conditions (marked by the green circles). Right now price has just bounced and cleared the blue line, which looks very encouraging on the daily chart, accompanied by a slight bullish divergence that has also formed.
From a daily perspective I would expect a move toward the LTF golden zone, which would likely align with BTC reaching back into the $70,000 range, as outlined in these related ideas:
The Weekly Timeframe
As stated, the weekly is the most important structure to examine. To begin, it is worth revisiting some of my past ideas, since the level price just bounced from is one I have been outlining for quite some time:
I had these levels outlined as the "Line in the Sand" and "Breakdown Target 2."
Now that more market structure has developed, the future path for price action is becoming clearer. There are many signs that COIN is getting close to a market cycle bottom, but it appears one more drop needs to occur before that bottom can be fully solidified.
My Updated Chart
On my updated chart I have added two white lines, one solid and one dotted, each angled differently but both structurally significant.
My hypothesis is that COIN will bottom somewhere around the 0.786 Fibonacci level and the dotted white trendline near early October 2026. If/when that occurs, I would also project a higher low forming on the weekly RSI somewhere around the white trendline in October.
It is difficult to say exactly where that low will land, but I would be eyeing the $110 to $120 range. As time and price get closer to this projection, I will be able to more precisely identify where the exact bottom is likely to occur.
To summarize, the lower timeframes look bullish for a move back to the upside in the near term. But looking further out toward Q4, one more drop is likely to sweep all the liquidity below the market structure that has been established over the past two years, ultimately creating the market cycle bottom.
This is also highly probable given that on the weekly timeframe, volume has continued declining with every bounce. Around the time of my October projection is when Coinbase will likely see a massive influx of volume return.
Only time will tell, but this is an early roadmap for what to expect.

Haftungsausschluss
Die Informationen und Veröffentlichungen sind nicht als Finanz-, Anlage-, Handels- oder andere Arten von Ratschlägen oder Empfehlungen gedacht, die von TradingView bereitgestellt oder gebilligt werden, und stellen diese nicht dar. Lesen Sie mehr in den Nutzungsbedingungen.
Haftungsausschluss
Die Informationen und Veröffentlichungen sind nicht als Finanz-, Anlage-, Handels- oder andere Arten von Ratschlägen oder Empfehlungen gedacht, die von TradingView bereitgestellt oder gebilligt werden, und stellen diese nicht dar. Lesen Sie mehr in den Nutzungsbedingungen.