
Concor India - Potential Double Bottom Breakout underway
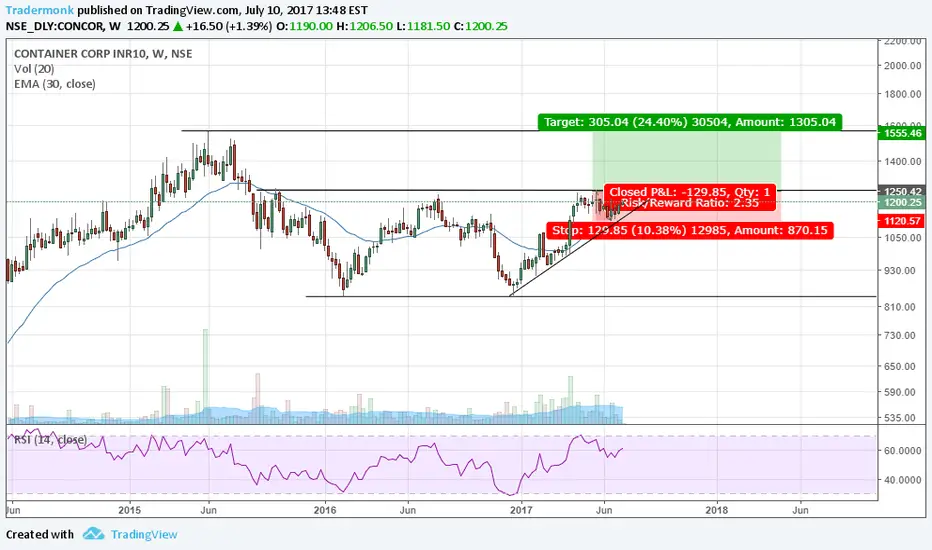
Potential Double bottom pattern (Adam & Adam formation) awaiting upward breakout observed in Concor India Ltd weekly chart.
Resistance zone is at 1200-1250 levels. A close above 1250 with higher volumes would indicate confirmation of the Double Bottom pattern formation which is a bullish sign for the stock.
Swing Trading Strategy :
Buy : Above 1250 level (on closing basis)
Target : 1550 (Old Resistance level as on 1st June 2015)
Stop Loss : Below 1120
Trade Safe !!!
Note : I have no current positions in this stock but may enter a position or multiple positions in the coming days and weeks.
Resistance zone is at 1200-1250 levels. A close above 1250 with higher volumes would indicate confirmation of the Double Bottom pattern formation which is a bullish sign for the stock.
Swing Trading Strategy :
Buy : Above 1250 level (on closing basis)
Target : 1550 (Old Resistance level as on 1st June 2015)
Stop Loss : Below 1120
Trade Safe !!!
Note : I have no current positions in this stock but may enter a position or multiple positions in the coming days and weeks.
Trade ist aktiv
Closed above 1250
Haftungsausschluss
Die Informationen und Veröffentlichungen sind nicht als Finanz-, Anlage-, Handels- oder andere Arten von Ratschlägen oder Empfehlungen gedacht, die von TradingView bereitgestellt oder gebilligt werden, und stellen diese nicht dar. Lesen Sie mehr in den Nutzungsbedingungen.
Haftungsausschluss
Die Informationen und Veröffentlichungen sind nicht als Finanz-, Anlage-, Handels- oder andere Arten von Ratschlägen oder Empfehlungen gedacht, die von TradingView bereitgestellt oder gebilligt werden, und stellen diese nicht dar. Lesen Sie mehr in den Nutzungsbedingungen.