CS Group - CSGN
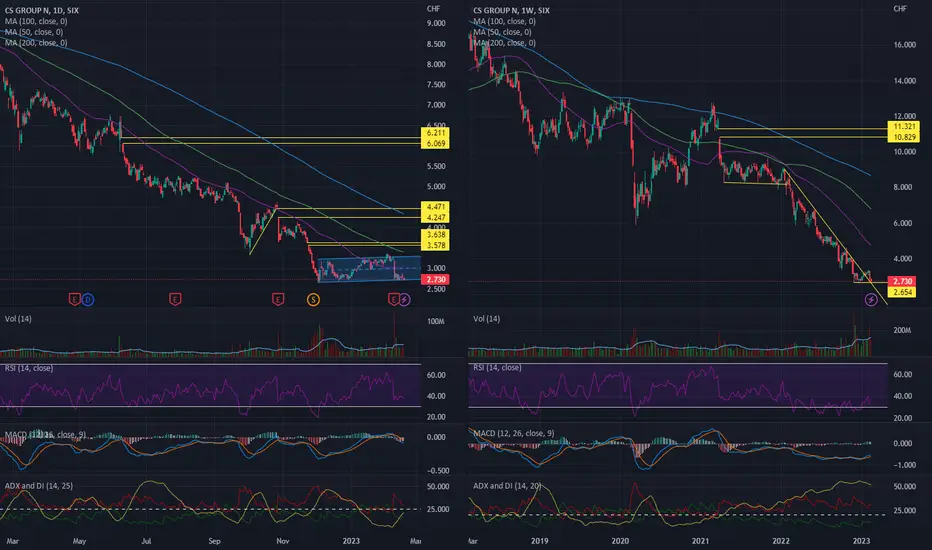
• Slightly upside corridor since beginning December 2022 (daily chart on the left side)
• The stock is currently trading at the bottom of the corridor (left side chart)
• Low volume in the last days (left side chart)
• Break out of the decreasing trend line in the last weeks (weekly chart on the right side)
• Supportline at 2.654 (right side chart)
• MACD line crossed the MACD Signal upward, which supports the outbreak of the decreasing trendline (right side chart)
• Stay neutral and wait if the support will hold
• The stock is currently trading at the bottom of the corridor (left side chart)
• Low volume in the last days (left side chart)
• Break out of the decreasing trend line in the last weeks (weekly chart on the right side)
• Supportline at 2.654 (right side chart)
• MACD line crossed the MACD Signal upward, which supports the outbreak of the decreasing trendline (right side chart)
• Stay neutral and wait if the support will hold

Haftungsausschluss
Die Informationen und Veröffentlichungen sind nicht als Finanz-, Anlage-, Handels- oder andere Arten von Ratschlägen oder Empfehlungen gedacht, die von TradingView bereitgestellt oder gebilligt werden, und stellen diese nicht dar. Lesen Sie mehr in den Nutzungsbedingungen.
Haftungsausschluss
Die Informationen und Veröffentlichungen sind nicht als Finanz-, Anlage-, Handels- oder andere Arten von Ratschlägen oder Empfehlungen gedacht, die von TradingView bereitgestellt oder gebilligt werden, und stellen diese nicht dar. Lesen Sie mehr in den Nutzungsbedingungen.