
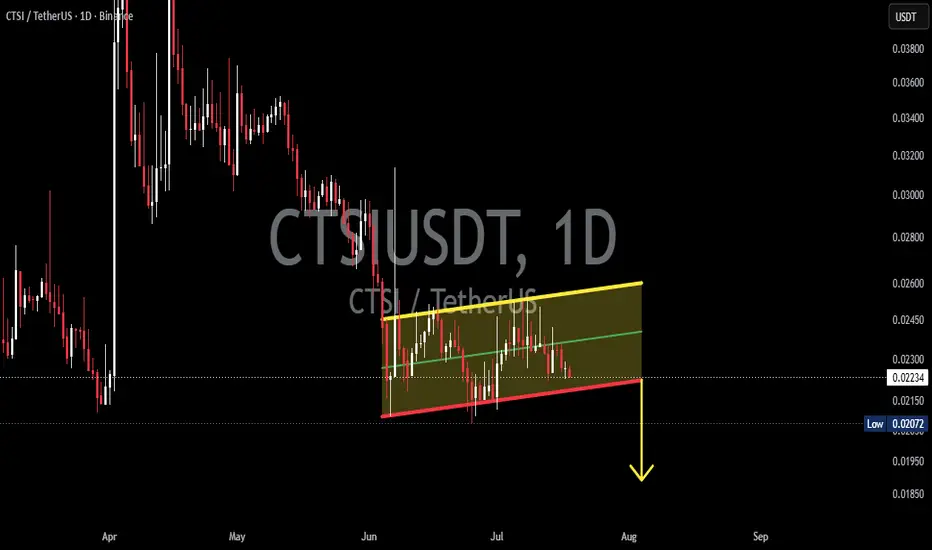
📊 Technical Analysis
💵 Coin: CTSI #CTSI
⏳ Time Frame: 1D
📉 Pattern: Bear Flag
🎯 Bias: Bearish Continuation
👀 Status: Testing the Lower Support Trendline
CTSI is currently forming a 🚩 Bear Flag pattern on the 1D timeframe, a classic bearish continuation pattern that typically develops after a strong downward move (flagpole), followed by a consolidation phase inside an ascending channel before the next major price movement.
📌 On this chart, price is trading within an ascending channel, which serves as the consolidation zone. As long as price remains inside this channel, both breakout and breakdown scenarios remain possible.
⚠️ However, since this pattern appears after a significant bearish trend, the probability still favors a continuation of the downtrend if the channel support is broken.
---
🔴 Bearish Scenario (Main Scenario) 📉
🚨 If price breaks down and closes below the lower trendline (Bear Flag support) with increasing volume, the 🚩 Bear Flag pattern will be confirmed.
This confirmation could trigger renewed selling pressure and continue the prevailing downtrend, which is the typical behavior of a Bear Flag.
📉 The stronger the breakdown, the higher the probability of a continuation toward the next key support levels.
📊 Probability
🔴 Bearish: 70–75%
---
🟢 Bullish Scenario (Alternative Scenario) 📈
✅ The bearish outlook will begin to weaken if price successfully breaks above the upper trendline with strong buying volume.
Such a breakout would indicate that buyers are regaining momentum, potentially shifting the short-term market structure into a bullish trend.
⚠️ However, as long as price remains inside the Bear Flag channel, any upward movement should still be considered a consolidation phase before the next major move.
📊 Probability
🟢 Bullish: 25–30%
---
📚 Pattern Explanation – 🚩 Bear Flag
A Bear Flag is a bearish continuation pattern that forms after a sharp decline (Flagpole), followed by a gradual upward consolidation inside a parallel ascending channel.
✨ Key Characteristics of a Bear Flag
✅ Begins with a strong bearish impulse (Flagpole)
📈 Price consolidates within an ascending channel
📉 Trading volume typically decreases during the consolidation phase
🚨 A breakdown below the channel support confirms the continuation of the bearish trend
🎯 The downside target is commonly projected using the length of the Flagpole once the pattern is confirmed.
💡 As long as the Bear Flag support remains intact, price is still in the consolidation phase, and traders should wait for a confirmed breakout or breakdown before making trading decisions.
---
📌 Conclusion 🎯
CTSI remains within a 🚩 Bear Flag structure on the 1D timeframe, making the channel support a critical level to watch.
🔻 Support Breakdown ➡️ Confirms the Bear Flag and increases the probability of further downside.
🔺 Resistance Breakout ➡️ Invalidates the Bear Flag and opens the possibility of a short-term trend reversal.
⚠️ Always wait for candle-close confirmation and strong volume before entering a trade. Don't forget to apply proper risk management in every position.
#CTSI #CTSIUSDT #Crypto #Cryptocurrency #Altcoins #Trading #TechnicalAnalysis #TradingView #BearFlag #Bearish #PriceAction #ChartPattern #CryptoTrading #Binance #MarketAnalysis #SwingTrading #Breakdown #SupportResistance #DYOR
💵 Coin:
CTSI #CTSI⏳ Time Frame: 1D
📉 Pattern: Bear Flag
🎯 Bias: Bearish Continuation
👀 Status: Testing the Lower Support Trendline
CTSI is currently forming a 🚩 Bear Flag pattern on the 1D timeframe, a classic bearish continuation pattern that typically develops after a strong downward move (flagpole), followed by a consolidation phase inside an ascending channel before the next major price movement.
📌 On this chart, price is trading within an ascending channel, which serves as the consolidation zone. As long as price remains inside this channel, both breakout and breakdown scenarios remain possible.
⚠️ However, since this pattern appears after a significant bearish trend, the probability still favors a continuation of the downtrend if the channel support is broken.
---
🔴 Bearish Scenario (Main Scenario) 📉
🚨 If price breaks down and closes below the lower trendline (Bear Flag support) with increasing volume, the 🚩 Bear Flag pattern will be confirmed.
This confirmation could trigger renewed selling pressure and continue the prevailing downtrend, which is the typical behavior of a Bear Flag.
📉 The stronger the breakdown, the higher the probability of a continuation toward the next key support levels.
📊 Probability
🔴 Bearish: 70–75%
---
🟢 Bullish Scenario (Alternative Scenario) 📈
✅ The bearish outlook will begin to weaken if price successfully breaks above the upper trendline with strong buying volume.
Such a breakout would indicate that buyers are regaining momentum, potentially shifting the short-term market structure into a bullish trend.
⚠️ However, as long as price remains inside the Bear Flag channel, any upward movement should still be considered a consolidation phase before the next major move.
📊 Probability
🟢 Bullish: 25–30%
---
📚 Pattern Explanation – 🚩 Bear Flag
A Bear Flag is a bearish continuation pattern that forms after a sharp decline (Flagpole), followed by a gradual upward consolidation inside a parallel ascending channel.
✨ Key Characteristics of a Bear Flag
✅ Begins with a strong bearish impulse (Flagpole)
📈 Price consolidates within an ascending channel
📉 Trading volume typically decreases during the consolidation phase
🚨 A breakdown below the channel support confirms the continuation of the bearish trend
🎯 The downside target is commonly projected using the length of the Flagpole once the pattern is confirmed.
💡 As long as the Bear Flag support remains intact, price is still in the consolidation phase, and traders should wait for a confirmed breakout or breakdown before making trading decisions.
---
📌 Conclusion 🎯
CTSI remains within a 🚩 Bear Flag structure on the 1D timeframe, making the channel support a critical level to watch.
🔻 Support Breakdown ➡️ Confirms the Bear Flag and increases the probability of further downside.
🔺 Resistance Breakout ➡️ Invalidates the Bear Flag and opens the possibility of a short-term trend reversal.
⚠️ Always wait for candle-close confirmation and strong volume before entering a trade. Don't forget to apply proper risk management in every position.
#CTSI #CTSIUSDT #Crypto #Cryptocurrency #Altcoins #Trading #TechnicalAnalysis #TradingView #BearFlag #Bearish #PriceAction #ChartPattern #CryptoTrading #Binance #MarketAnalysis #SwingTrading #Breakdown #SupportResistance #DYOR

✅ Get Free Signals! Join Our Telegram Channel Here: t.me/TheCryptoNuclear
✅ Twitter: twitter.com/crypto_nuclear
✅ Join Bybit : partner.bybit.com/b/nuclearvip
✅ Benefits : Lifetime Trading Fee Discount -50%
✅ Twitter: twitter.com/crypto_nuclear
✅ Join Bybit : partner.bybit.com/b/nuclearvip
✅ Benefits : Lifetime Trading Fee Discount -50%
Haftungsausschluss
Die Informationen und Veröffentlichungen sind nicht als Finanz-, Anlage-, Handels- oder andere Arten von Ratschlägen oder Empfehlungen gedacht, die von TradingView bereitgestellt oder gebilligt werden, und stellen diese nicht dar. Lesen Sie mehr in den Nutzungsbedingungen.
✅ Get Free Signals! Join Our Telegram Channel Here: t.me/TheCryptoNuclear
✅ Twitter: twitter.com/crypto_nuclear
✅ Join Bybit : partner.bybit.com/b/nuclearvip
✅ Benefits : Lifetime Trading Fee Discount -50%
✅ Twitter: twitter.com/crypto_nuclear
✅ Join Bybit : partner.bybit.com/b/nuclearvip
✅ Benefits : Lifetime Trading Fee Discount -50%
Haftungsausschluss
Die Informationen und Veröffentlichungen sind nicht als Finanz-, Anlage-, Handels- oder andere Arten von Ratschlägen oder Empfehlungen gedacht, die von TradingView bereitgestellt oder gebilligt werden, und stellen diese nicht dar. Lesen Sie mehr in den Nutzungsbedingungen.