
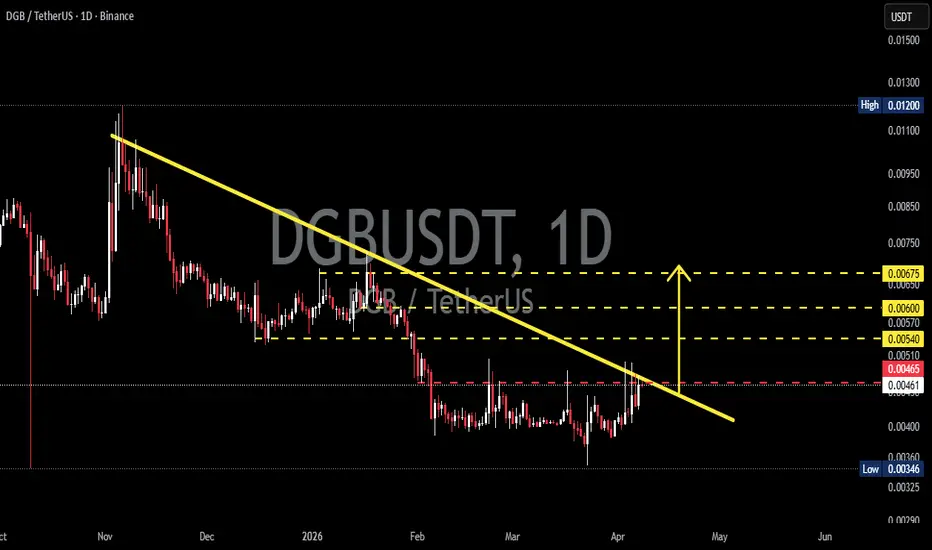
On the 1D timeframe, DGB/USDT is clearly in a downtrend, characterized by consistent lower highs and lower lows since the previous peak.
Currently, price is testing the descending trendline resistance (yellow line), which is a key level that will determine the next major move.
---
📐 Pattern Formation: Descending Triangle / Falling Resistance
A clear descending resistance trendline has been tested multiple times.
Support is relatively stable in the lower zone (around 0.0034 – 0.0040).
This structure suggests that selling pressure is still dominant, but signs of accumulation at the bottom are starting to appear.
➡️ This pattern often leads to:
Bearish continuation if breakout fails
Early bullish reversal if a valid breakout occurs
---
🟡 Key Levels
Immediate resistance: 0.0046
Next resistance: 0.0054 – 0.0060
Main bullish target: 0.0067
Strong support: 0.0034
---
🚀 Bullish Scenario
If price manages to:
Break and close above the trendline + 0.0046 resistance
Then potential upside targets:
0.0054
0.0060
0.0067
📈 This would indicate:
A valid breakout from the downtrend
A shift in structure toward higher highs
---
🔻 Bearish Scenario
If price:
Fails to break the trendline
Or gets rejected around the 0.0046 level
Then the likely move:
Drop back to 0.0040
Potential retest of 0.0034 (previous low)
📉 This would confirm:
The downtrend is still intact
The breakout attempt was a fakeout / liquidity grab
---
⚠️ Important Notes
Watch for volume confirmation during breakout — higher volume = stronger validity
Avoid entering before a clear candle close
Current zone is a key decision area
---
🏷️ Conclusion
Price is at a critical level. A breakout above the descending trendline could trigger a significant reversal, while rejection would likely continue the downtrend.
#DGBUSDT #CryptoAnalysis #TechnicalAnalysis #Altcoins #CryptoTrading #Breakout #DescendingTriangle #BullishScenario #BearishScenario #SupportResistance #PriceAction #CryptoSignals
Currently, price is testing the descending trendline resistance (yellow line), which is a key level that will determine the next major move.
---
📐 Pattern Formation: Descending Triangle / Falling Resistance
A clear descending resistance trendline has been tested multiple times.
Support is relatively stable in the lower zone (around 0.0034 – 0.0040).
This structure suggests that selling pressure is still dominant, but signs of accumulation at the bottom are starting to appear.
➡️ This pattern often leads to:
Bearish continuation if breakout fails
Early bullish reversal if a valid breakout occurs
---
🟡 Key Levels
Immediate resistance: 0.0046
Next resistance: 0.0054 – 0.0060
Main bullish target: 0.0067
Strong support: 0.0034
---
🚀 Bullish Scenario
If price manages to:
Break and close above the trendline + 0.0046 resistance
Then potential upside targets:
0.0054
0.0060
0.0067
📈 This would indicate:
A valid breakout from the downtrend
A shift in structure toward higher highs
---
🔻 Bearish Scenario
If price:
Fails to break the trendline
Or gets rejected around the 0.0046 level
Then the likely move:
Drop back to 0.0040
Potential retest of 0.0034 (previous low)
📉 This would confirm:
The downtrend is still intact
The breakout attempt was a fakeout / liquidity grab
---
⚠️ Important Notes
Watch for volume confirmation during breakout — higher volume = stronger validity
Avoid entering before a clear candle close
Current zone is a key decision area
---
🏷️ Conclusion
Price is at a critical level. A breakout above the descending trendline could trigger a significant reversal, while rejection would likely continue the downtrend.
#DGBUSDT #CryptoAnalysis #TechnicalAnalysis #Altcoins #CryptoTrading #Breakout #DescendingTriangle #BullishScenario #BearishScenario #SupportResistance #PriceAction #CryptoSignals

✅ Get Free Signals! Join Our Telegram Channel Here: t.me/TheCryptoNuclear
✅ Twitter: twitter.com/crypto_nuclear
✅ Join Bybit : partner.bybit.com/b/nuclearvip
✅ Benefits : Lifetime Trading Fee Discount -50%
✅ Twitter: twitter.com/crypto_nuclear
✅ Join Bybit : partner.bybit.com/b/nuclearvip
✅ Benefits : Lifetime Trading Fee Discount -50%
Haftungsausschluss
Die Informationen und Veröffentlichungen sind nicht als Finanz-, Anlage-, Handels- oder andere Arten von Ratschlägen oder Empfehlungen gedacht, die von TradingView bereitgestellt oder gebilligt werden, und stellen diese nicht dar. Lesen Sie mehr in den Nutzungsbedingungen.
✅ Get Free Signals! Join Our Telegram Channel Here: t.me/TheCryptoNuclear
✅ Twitter: twitter.com/crypto_nuclear
✅ Join Bybit : partner.bybit.com/b/nuclearvip
✅ Benefits : Lifetime Trading Fee Discount -50%
✅ Twitter: twitter.com/crypto_nuclear
✅ Join Bybit : partner.bybit.com/b/nuclearvip
✅ Benefits : Lifetime Trading Fee Discount -50%
Haftungsausschluss
Die Informationen und Veröffentlichungen sind nicht als Finanz-, Anlage-, Handels- oder andere Arten von Ratschlägen oder Empfehlungen gedacht, die von TradingView bereitgestellt oder gebilligt werden, und stellen diese nicht dar. Lesen Sie mehr in den Nutzungsbedingungen.