
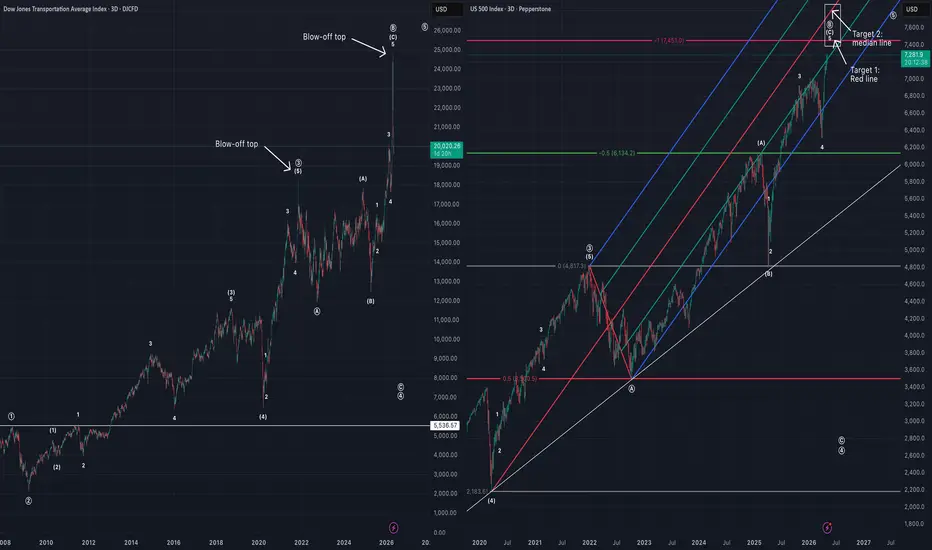
Chart comparing DJT and US500.
This comparison assumes both are in similar positions regarding their supercycle structures.
DJT has already completed its ((B)) wave with a blow-off top, as DJT tends to be a leading rather than lagging indicator for the larger equity markets.
US500 has been very technical since COVID low. I'm looking for it to top around 7451 or perhaps it goes a little bit extra to the median line target.
This comparison assumes both are in similar positions regarding their supercycle structures.
DJT has already completed its ((B)) wave with a blow-off top, as DJT tends to be a leading rather than lagging indicator for the larger equity markets.
US500 has been very technical since COVID low. I'm looking for it to top around 7451 or perhaps it goes a little bit extra to the median line target.

Haftungsausschluss
Die Informationen und Veröffentlichungen sind nicht als Finanz-, Anlage-, Handels- oder andere Arten von Ratschlägen oder Empfehlungen gedacht, die von TradingView bereitgestellt oder gebilligt werden, und stellen diese nicht dar. Lesen Sie mehr in den Nutzungsbedingungen.
Haftungsausschluss
Die Informationen und Veröffentlichungen sind nicht als Finanz-, Anlage-, Handels- oder andere Arten von Ratschlägen oder Empfehlungen gedacht, die von TradingView bereitgestellt oder gebilligt werden, und stellen diese nicht dar. Lesen Sie mehr in den Nutzungsbedingungen.