
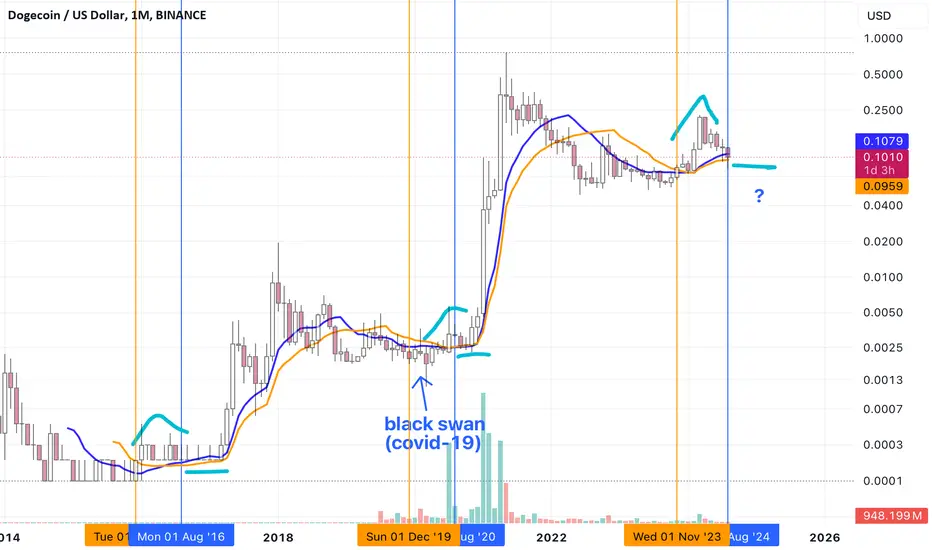
If historic price action mean something dogecoin is getting ready to fly, you can see that especially on the weekly and monthly timeframes.
At naked eye you see it,
see even better if you plot fibonacci time zones, and some moving averages on the chart.
Imo with proper risk management is a good long opportunity.
PS: the orange vertical line is there bcause that's wen the price closed above my sma's, the blue line is there just bcause we're in august
At naked eye you see it,
see even better if you plot fibonacci time zones, and some moving averages on the chart.
Imo with proper risk management is a good long opportunity.
PS: the orange vertical line is there bcause that's wen the price closed above my sma's, the blue line is there just bcause we're in august

Haftungsausschluss
Die Informationen und Veröffentlichungen sind nicht als Finanz-, Anlage-, Handels- oder andere Arten von Ratschlägen oder Empfehlungen gedacht, die von TradingView bereitgestellt oder gebilligt werden, und stellen diese nicht dar. Lesen Sie mehr in den Nutzungsbedingungen.
Haftungsausschluss
Die Informationen und Veröffentlichungen sind nicht als Finanz-, Anlage-, Handels- oder andere Arten von Ratschlägen oder Empfehlungen gedacht, die von TradingView bereitgestellt oder gebilligt werden, und stellen diese nicht dar. Lesen Sie mehr in den Nutzungsbedingungen.