
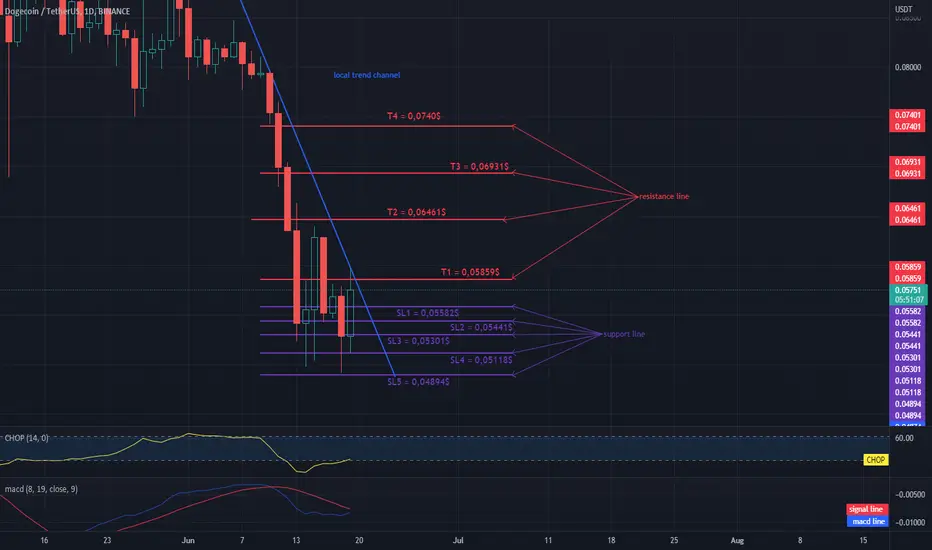
Hello everyone, let's take a look at the DOGE to USDT chart on the 1 day timeframe as you can see the price is moving below the downtrend line.
Let's start with setting targets for the nearest future that we can take into account:
T1 = $ 0.05859
T2 = $ 0.06461
T3 = $ 0.06931
and
T4 = $ 0.0740
Now let's move on to the stop loss to keep in the event of further market declines:
SL1 = $ 0.05582
SL2 = $ 0.05441
SL3 = $ 0.05301
SL4 = $ 0.05118
and
SL5 = $ 0.04894
Looking at the CHOP indicator, we can see that in the 1-day interval the energy is slowly starting to bounce back, and the MACD indicator shows that we are in a downward trend, while the blue line is approaching the red one.
Let's start with setting targets for the nearest future that we can take into account:
T1 = $ 0.05859
T2 = $ 0.06461
T3 = $ 0.06931
and
T4 = $ 0.0740
Now let's move on to the stop loss to keep in the event of further market declines:
SL1 = $ 0.05582
SL2 = $ 0.05441
SL3 = $ 0.05301
SL4 = $ 0.05118
and
SL5 = $ 0.04894
Looking at the CHOP indicator, we can see that in the 1-day interval the energy is slowly starting to bounce back, and the MACD indicator shows that we are in a downward trend, while the blue line is approaching the red one.

Haftungsausschluss
Die Informationen und Veröffentlichungen sind nicht als Finanz-, Anlage-, Handels- oder andere Arten von Ratschlägen oder Empfehlungen gedacht, die von TradingView bereitgestellt oder gebilligt werden, und stellen diese nicht dar. Lesen Sie mehr in den Nutzungsbedingungen.
Haftungsausschluss
Die Informationen und Veröffentlichungen sind nicht als Finanz-, Anlage-, Handels- oder andere Arten von Ratschlägen oder Empfehlungen gedacht, die von TradingView bereitgestellt oder gebilligt werden, und stellen diese nicht dar. Lesen Sie mehr in den Nutzungsbedingungen.