
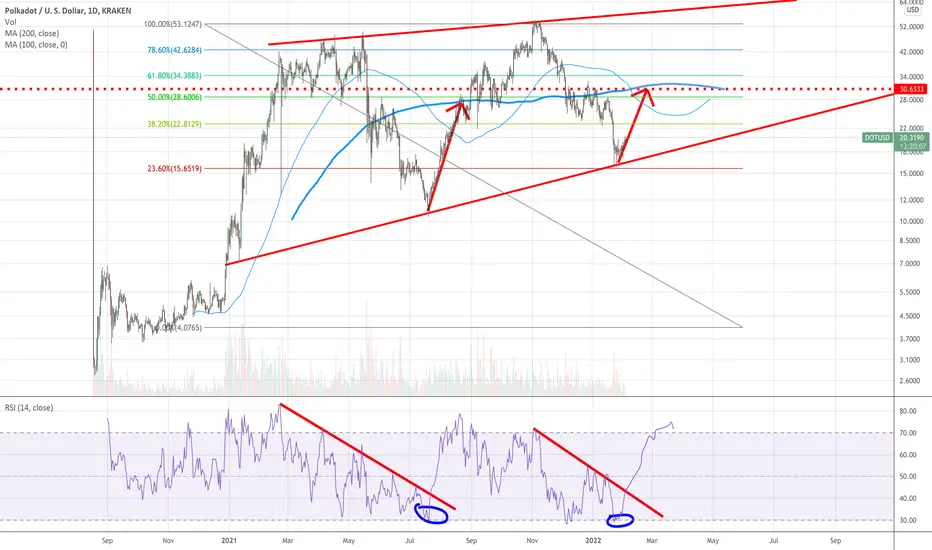
Polkadot forming a long-TF ascending triangle on Daily
2nd bottom & re-test of the ascending triangle seams to be confirmed by:
- RSI bottomed and about to breakout (same levels as mid-july 2021 selloff)
- Current overall market reaction
- 23.6 Fib level acting once again as nice support
- MA 100 & 200 seem to re-create a similar pattern as during mid-july 2021 selloff
Potential 50% gains until EO Feb 2022.
Entry at 19-20$
Stop loss at 17.90$
--> Target 28-31$
Happy Trading!
2nd bottom & re-test of the ascending triangle seams to be confirmed by:
- RSI bottomed and about to breakout (same levels as mid-july 2021 selloff)
- Current overall market reaction
- 23.6 Fib level acting once again as nice support
- MA 100 & 200 seem to re-create a similar pattern as during mid-july 2021 selloff
Potential 50% gains until EO Feb 2022.
Entry at 19-20$
Stop loss at 17.90$
--> Target 28-31$
Happy Trading!
Trade ist aktiv
Idea Is still ValidTrade geschlossen: Stop wurde erreicht

Haftungsausschluss
Die Informationen und Veröffentlichungen sind nicht als Finanz-, Anlage-, Handels- oder andere Arten von Ratschlägen oder Empfehlungen gedacht, die von TradingView bereitgestellt oder gebilligt werden, und stellen diese nicht dar. Lesen Sie mehr in den Nutzungsbedingungen.
Haftungsausschluss
Die Informationen und Veröffentlichungen sind nicht als Finanz-, Anlage-, Handels- oder andere Arten von Ratschlägen oder Empfehlungen gedacht, die von TradingView bereitgestellt oder gebilligt werden, und stellen diese nicht dar. Lesen Sie mehr in den Nutzungsbedingungen.