
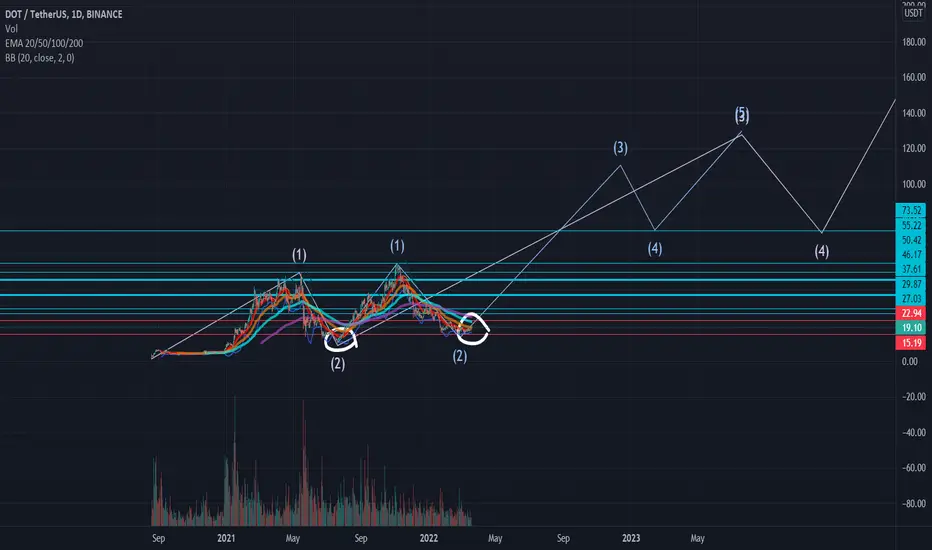
Testing/tracking elliot wave theory. Please do not trade off idea without S/L. Not financial advice.
Link to previous chart:
tradingview.com/u/AyoKu/
The retracement went way lower than my prediction. We're at the bottom of the red support line which would be the indication of the end of this wave (2) retracement. If this chart is to play out we cant go lower than $10.5 for the blue wave. There is another wave not shown here which can make this chart still valid if we go below. If this happens, I'll post the updated chart below. The EMA 20 (red line) is starting to curl up, if it can go above the other 3 EMA lines (refer to the white circle) then we can see a repeat of something similar on the last impulse wave which created the first blue wave (1).
Link to previous chart:
tradingview.com/u/AyoKu/
The retracement went way lower than my prediction. We're at the bottom of the red support line which would be the indication of the end of this wave (2) retracement. If this chart is to play out we cant go lower than $10.5 for the blue wave. There is another wave not shown here which can make this chart still valid if we go below. If this happens, I'll post the updated chart below. The EMA 20 (red line) is starting to curl up, if it can go above the other 3 EMA lines (refer to the white circle) then we can see a repeat of something similar on the last impulse wave which created the first blue wave (1).

Haftungsausschluss
Die Informationen und Veröffentlichungen sind nicht als Finanz-, Anlage-, Handels- oder andere Arten von Ratschlägen oder Empfehlungen gedacht, die von TradingView bereitgestellt oder gebilligt werden, und stellen diese nicht dar. Lesen Sie mehr in den Nutzungsbedingungen.
Haftungsausschluss
Die Informationen und Veröffentlichungen sind nicht als Finanz-, Anlage-, Handels- oder andere Arten von Ratschlägen oder Empfehlungen gedacht, die von TradingView bereitgestellt oder gebilligt werden, und stellen diese nicht dar. Lesen Sie mehr in den Nutzungsbedingungen.