
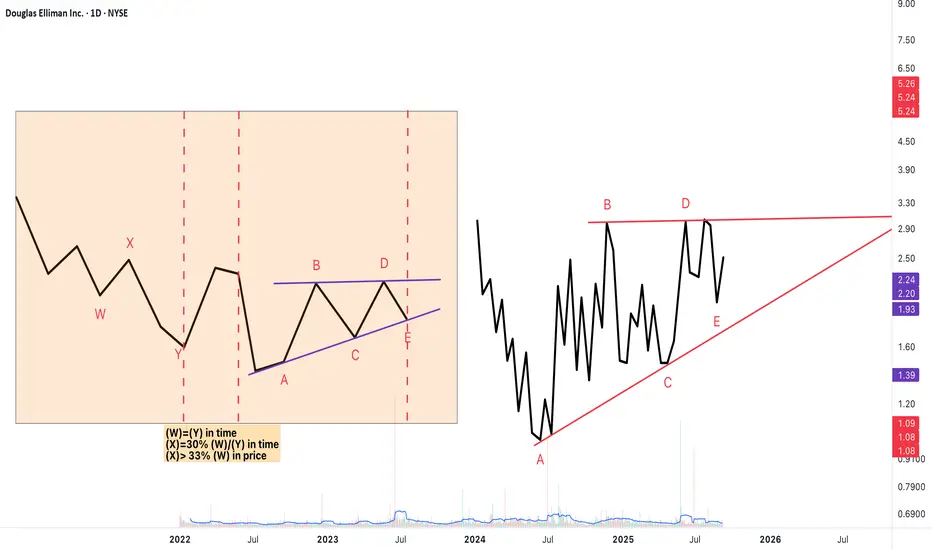
This chart presents a NeoWave structural interpretation of DOUG, combining the higher-degree schematic (left) with the real market data (right).
On the 6-month structural model (left panel), we label the decline as (W), followed by an intervening (X), and now developing into a potential (Y) = upsloping contracting triangle.
On the daily chart (right panel), starting from the end of wave (X), price action subdivides into a five-legged contracting triangle: A–B–C–D–E.
The upper boundary is flat, repeatedly tested by waves B and D.
The lower boundary is rising, defined by waves A, C, and E.
Wave B is the most violent, while E is smaller in price but longer in time – acceptable under NeoWave guidelines.
Implications:
If the labeling is correct, this triangle represents wave (Y).
Upon completion, two scenarios are possible:
Continuation – If the larger pattern is a W–X–Y, the triangle could be the terminal corrective structure, followed by a strong breakout.
Extension – If the correction is not yet complete, the triangle as (Y) could be followed by another X–Z to form a full W–X–Y–X–Z complex.
👉 Key Level: If price breaks out of the triangle to the upside and holds above 3.00, this would strongly suggest the start of a new trend or the beginning of another upward (X) wave.
👉 Target Projection: Based on the triangle’s height (B–C range = 2.60–1.48 ≈ 1.12), the potential upside target lies near 4.10–4.15.
On the 6-month structural model (left panel), we label the decline as (W), followed by an intervening (X), and now developing into a potential (Y) = upsloping contracting triangle.
On the daily chart (right panel), starting from the end of wave (X), price action subdivides into a five-legged contracting triangle: A–B–C–D–E.
The upper boundary is flat, repeatedly tested by waves B and D.
The lower boundary is rising, defined by waves A, C, and E.
Wave B is the most violent, while E is smaller in price but longer in time – acceptable under NeoWave guidelines.
Implications:
If the labeling is correct, this triangle represents wave (Y).
Upon completion, two scenarios are possible:
Continuation – If the larger pattern is a W–X–Y, the triangle could be the terminal corrective structure, followed by a strong breakout.
Extension – If the correction is not yet complete, the triangle as (Y) could be followed by another X–Z to form a full W–X–Y–X–Z complex.
👉 Key Level: If price breaks out of the triangle to the upside and holds above 3.00, this would strongly suggest the start of a new trend or the beginning of another upward (X) wave.
👉 Target Projection: Based on the triangle’s height (B–C range = 2.60–1.48 ≈ 1.12), the potential upside target lies near 4.10–4.15.

Haftungsausschluss
Die Informationen und Veröffentlichungen sind nicht als Finanz-, Anlage-, Handels- oder andere Arten von Ratschlägen oder Empfehlungen gedacht, die von TradingView bereitgestellt oder gebilligt werden, und stellen diese nicht dar. Lesen Sie mehr in den Nutzungsbedingungen.
Haftungsausschluss
Die Informationen und Veröffentlichungen sind nicht als Finanz-, Anlage-, Handels- oder andere Arten von Ratschlägen oder Empfehlungen gedacht, die von TradingView bereitgestellt oder gebilligt werden, und stellen diese nicht dar. Lesen Sie mehr in den Nutzungsbedingungen.