
Overview
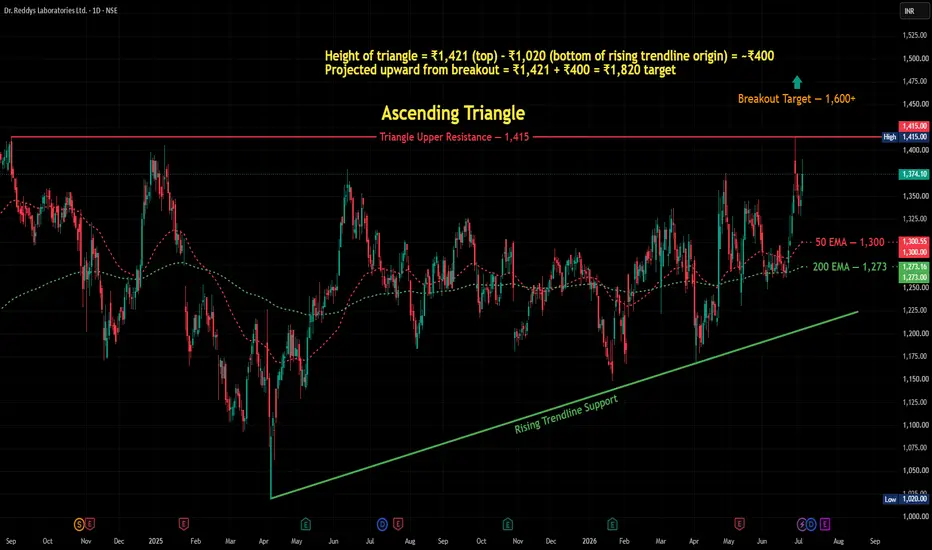
Dr. Reddy's Laboratories — one of India's leading pharmaceutical companies — is forming a well-defined Ascending Triangle on the Daily chart. Today's strong +2.11% session pushed price to ₹1,390, approaching the key resistance at ₹1,415, before closing at ₹1,374. The triangle structure remains intact and the breakout zone is approaching.
The Ascending Triangle
An Ascending Triangle forms when price makes higher lows (rising trendline below) while repeatedly testing a flat horizontal resistance above. This pattern signals accumulation — buyers are consistently stepping in at higher levels, pushing price toward the resistance ceiling.
Upper Boundary: Flat resistance at ₹1,415 — tested multiple times since 2024. Sellers have defended this level consistently. This is the key breakout trigger.
Lower Boundary: Rising trendline support connecting the lows from April 2025 through February 2026 — confirming buyers are making higher lows over time.
Today's Price Action — Why This Setup is Timely
Today's +2.11% session saw Dr. Reddy's rally to ₹1,390 — approaching but not yet breaking the ₹1,415 resistance. Price closed at ₹1,374, consolidating within the triangle structure. The ascending triangle remains fully intact.
The stock is in the compression zone — the narrowing space between rising support and flat resistance — where the next directional move is building energy.
The EMA Context
📈 50 EMA at ₹1,300 — price trading well above, confirming medium-term bullish momentum.
📈 200 EMA at ₹1,273 — price above the 200 EMA, confirming the long-term trend remains bullish.
Both EMAs are positioned as support layers below — adding depth to the bullish structure.
Key Levels
🔴 Triangle Upper Resistance — 1,415 (breakout trigger)
🟡 Current Price — 1,374 (inside triangle)
🟢 50 EMA Support — 1,300
🟢 200 EMA Support — 1,273
🟢 Rising Trendline Support — dynamic, rising from April 2025 lows
🎯 Measured Move Target — 1,820 (triangle height ₹400 projected from breakout at 1,415)
🔴 Invalidation — close below rising trendline
Two Scenarios
🟢 Scenario A — Breakout Confirms
Price breaks above ₹1,415 on a daily close with good volume. This confirms the Ascending Triangle breakout. First interim target is ₹1,600+, with a measured move target of ₹1,820 (triangle height of ~₹400 projected upward from the breakout level).
🔴 Scenario B — Resistance Holds, Pullback
Price fails to break above ₹1,415 and pulls back toward the rising trendline support. The triangle structure remains valid as long as price holds above the rising trendline. A close below the trendline would invalidate the pattern — watch the 50 EMA at ₹1,300 as the next support.
Beginner's Lesson — What is an Ascending Triangle?
An Ascending Triangle tells a story of shifting power from sellers to buyers:
The flat resistance shows sellers defending the same price level repeatedly
The rising trendline shows buyers becoming more aggressive — unwilling to wait for lower prices
As the two lines converge, pressure builds inside the pattern
Eventually buyers overwhelm sellers — and the breakout happens
The key insight: the pattern is bullish not because of the breakout, but because of the higher lows forming before it. Each higher low is a sign buyers are getting stronger.
Always wait for a confirmed daily close above ₹1,415 before acting — not just an intraday breach.
Conclusion
Dr. Reddy's is forming a clean Ascending Triangle on the Daily chart. The upper resistance at ₹1,415 is the key level — multiple tests, multiple rejections. But the rising trendline below shows buyers getting stronger with each pullback.
Watch for a daily close above ₹1,415 with volume — that is the confirmation signal.
For educational purposes only. Not financial advice. Always manage your risk.
Dr. Reddy's Laboratories — one of India's leading pharmaceutical companies — is forming a well-defined Ascending Triangle on the Daily chart. Today's strong +2.11% session pushed price to ₹1,390, approaching the key resistance at ₹1,415, before closing at ₹1,374. The triangle structure remains intact and the breakout zone is approaching.
The Ascending Triangle
An Ascending Triangle forms when price makes higher lows (rising trendline below) while repeatedly testing a flat horizontal resistance above. This pattern signals accumulation — buyers are consistently stepping in at higher levels, pushing price toward the resistance ceiling.
Upper Boundary: Flat resistance at ₹1,415 — tested multiple times since 2024. Sellers have defended this level consistently. This is the key breakout trigger.
Lower Boundary: Rising trendline support connecting the lows from April 2025 through February 2026 — confirming buyers are making higher lows over time.
Today's Price Action — Why This Setup is Timely
Today's +2.11% session saw Dr. Reddy's rally to ₹1,390 — approaching but not yet breaking the ₹1,415 resistance. Price closed at ₹1,374, consolidating within the triangle structure. The ascending triangle remains fully intact.
The stock is in the compression zone — the narrowing space between rising support and flat resistance — where the next directional move is building energy.
The EMA Context
📈 50 EMA at ₹1,300 — price trading well above, confirming medium-term bullish momentum.
📈 200 EMA at ₹1,273 — price above the 200 EMA, confirming the long-term trend remains bullish.
Both EMAs are positioned as support layers below — adding depth to the bullish structure.
Key Levels
🔴 Triangle Upper Resistance — 1,415 (breakout trigger)
🟡 Current Price — 1,374 (inside triangle)
🟢 50 EMA Support — 1,300
🟢 200 EMA Support — 1,273
🟢 Rising Trendline Support — dynamic, rising from April 2025 lows
🎯 Measured Move Target — 1,820 (triangle height ₹400 projected from breakout at 1,415)
🔴 Invalidation — close below rising trendline
Two Scenarios
🟢 Scenario A — Breakout Confirms
Price breaks above ₹1,415 on a daily close with good volume. This confirms the Ascending Triangle breakout. First interim target is ₹1,600+, with a measured move target of ₹1,820 (triangle height of ~₹400 projected upward from the breakout level).
🔴 Scenario B — Resistance Holds, Pullback
Price fails to break above ₹1,415 and pulls back toward the rising trendline support. The triangle structure remains valid as long as price holds above the rising trendline. A close below the trendline would invalidate the pattern — watch the 50 EMA at ₹1,300 as the next support.
Beginner's Lesson — What is an Ascending Triangle?
An Ascending Triangle tells a story of shifting power from sellers to buyers:
The flat resistance shows sellers defending the same price level repeatedly
The rising trendline shows buyers becoming more aggressive — unwilling to wait for lower prices
As the two lines converge, pressure builds inside the pattern
Eventually buyers overwhelm sellers — and the breakout happens
The key insight: the pattern is bullish not because of the breakout, but because of the higher lows forming before it. Each higher low is a sign buyers are getting stronger.
Always wait for a confirmed daily close above ₹1,415 before acting — not just an intraday breach.
Conclusion
Dr. Reddy's is forming a clean Ascending Triangle on the Daily chart. The upper resistance at ₹1,415 is the key level — multiple tests, multiple rejections. But the rising trendline below shows buyers getting stronger with each pullback.
Watch for a daily close above ₹1,415 with volume — that is the confirmation signal.
For educational purposes only. Not financial advice. Always manage your risk.

📈 HK Trading Community | Market Structure & Indicator Updates
Telegram: t.me/trendstrike1000
Website: quantumedgepro.netlify.app/
Real traders are built through learning,not tip hunting.So Start Learning How the Market Really Works
Telegram: t.me/trendstrike1000
Website: quantumedgepro.netlify.app/
Real traders are built through learning,not tip hunting.So Start Learning How the Market Really Works
Haftungsausschluss
Die Informationen und Veröffentlichungen sind nicht als Finanz-, Anlage-, Handels- oder andere Arten von Ratschlägen oder Empfehlungen gedacht, die von TradingView bereitgestellt oder gebilligt werden, und stellen diese nicht dar. Lesen Sie mehr in den Nutzungsbedingungen.
📈 HK Trading Community | Market Structure & Indicator Updates
Telegram: t.me/trendstrike1000
Website: quantumedgepro.netlify.app/
Real traders are built through learning,not tip hunting.So Start Learning How the Market Really Works
Telegram: t.me/trendstrike1000
Website: quantumedgepro.netlify.app/
Real traders are built through learning,not tip hunting.So Start Learning How the Market Really Works
Haftungsausschluss
Die Informationen und Veröffentlichungen sind nicht als Finanz-, Anlage-, Handels- oder andere Arten von Ratschlägen oder Empfehlungen gedacht, die von TradingView bereitgestellt oder gebilligt werden, und stellen diese nicht dar. Lesen Sie mehr in den Nutzungsbedingungen.