
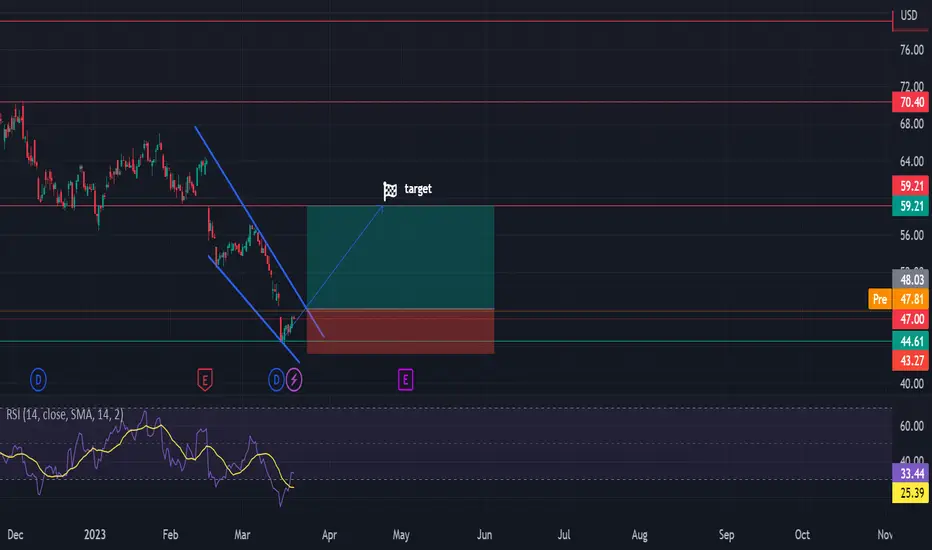
Devon Energy Corporation is on a descending triangle, so we expect a retracement of the price. Moreover the price is hitting both the support and the band of the triangle, making the price more likely to raise, Also the RSI index shows that the stocks are oversold, further strengthen this theory. You can go long on this stock as soon as its price breaks the upper band of the triangle. You can then sell in the resistance as shown in the chart.
Trade ist aktiv
breakoutAnmerkung
Good progress so far
💥 Free signals and ideas ➡ t.me/vfinvestment
Verbundene Veröffentlichungen
Haftungsausschluss
Die Informationen und Veröffentlichungen sind nicht als Finanz-, Anlage-, Handels- oder andere Arten von Ratschlägen oder Empfehlungen gedacht, die von TradingView bereitgestellt oder gebilligt werden, und stellen diese nicht dar. Lesen Sie mehr in den Nutzungsbedingungen.
💥 Free signals and ideas ➡ t.me/vfinvestment
Verbundene Veröffentlichungen
Haftungsausschluss
Die Informationen und Veröffentlichungen sind nicht als Finanz-, Anlage-, Handels- oder andere Arten von Ratschlägen oder Empfehlungen gedacht, die von TradingView bereitgestellt oder gebilligt werden, und stellen diese nicht dar. Lesen Sie mehr in den Nutzungsbedingungen.