
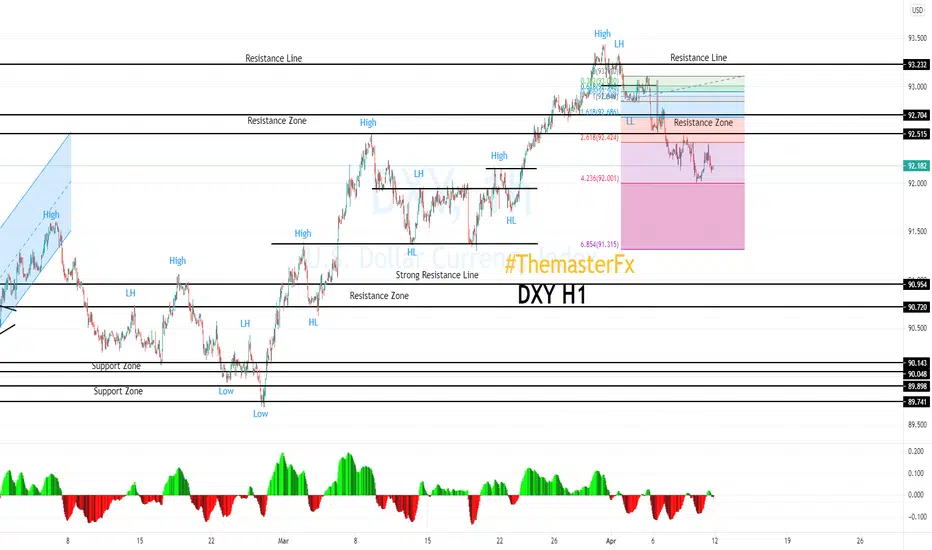
DXY on the 1H time-frame.
Steps:
1. The index created the lower high and breakout the previous low to confirmed the reversal pattern.
2. The index was running downtrend and already hit the Fibonacci level 423.6%
3. If the index breakout the previous low at 92.001 then the next level will be at the Fibonacci 685.4% at 91.315 or 91.378 at the support zone.
Steps:
1. The index created the lower high and breakout the previous low to confirmed the reversal pattern.
2. The index was running downtrend and already hit the Fibonacci level 423.6%
3. If the index breakout the previous low at 92.001 then the next level will be at the Fibonacci 685.4% at 91.315 or 91.378 at the support zone.

Haftungsausschluss
Die Informationen und Veröffentlichungen sind nicht als Finanz-, Anlage-, Handels- oder andere Arten von Ratschlägen oder Empfehlungen gedacht, die von TradingView bereitgestellt oder gebilligt werden, und stellen diese nicht dar. Lesen Sie mehr in den Nutzungsbedingungen.
Haftungsausschluss
Die Informationen und Veröffentlichungen sind nicht als Finanz-, Anlage-, Handels- oder andere Arten von Ratschlägen oder Empfehlungen gedacht, die von TradingView bereitgestellt oder gebilligt werden, und stellen diese nicht dar. Lesen Sie mehr in den Nutzungsbedingungen.