
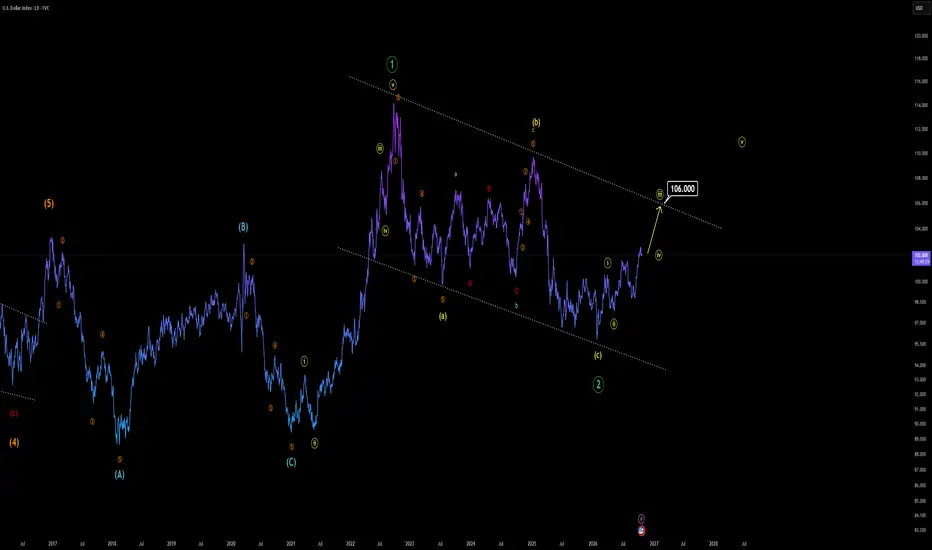
DXY is showing strength due to both fundamental and technical reasons.
I'm not going to bother you with all the fundamental details of why it's supposed to be going up even more, but I'm sure that pretty much anyone who has been trading for at least a year has heard the term "yields".
Let's get back to the real thing.
Wave counting from the last cycle suggests that DXY started a major bull run from the last dip around 2008 (Yes, I have analyzed it all the way from there).
At the moment, DXY is sitting in a large channel which is labeled as wave 2. This channel will break in the coming weeks because currently the price is in WAVE 3. This also means the target shown on the chart is only a short-term destination.
DXY will go higher in the months ahead as long as no invalidation occurs. If that happens, I'll let you know.
If you think it's impossible for DXY to climb "that high", examine the gold analysis I made last year and see the results for yourself. Wave counting shows you where the price might actually be going rather than simply drawing boxes around the chart.
Thanks for reading.
I'm not going to bother you with all the fundamental details of why it's supposed to be going up even more, but I'm sure that pretty much anyone who has been trading for at least a year has heard the term "yields".
Let's get back to the real thing.
Wave counting from the last cycle suggests that DXY started a major bull run from the last dip around 2008 (Yes, I have analyzed it all the way from there).
At the moment, DXY is sitting in a large channel which is labeled as wave 2. This channel will break in the coming weeks because currently the price is in WAVE 3. This also means the target shown on the chart is only a short-term destination.
DXY will go higher in the months ahead as long as no invalidation occurs. If that happens, I'll let you know.
If you think it's impossible for DXY to climb "that high", examine the gold analysis I made last year and see the results for yourself. Wave counting shows you where the price might actually be going rather than simply drawing boxes around the chart.
Thanks for reading.

Verbundene Veröffentlichungen
Haftungsausschluss
Die Informationen und Veröffentlichungen sind nicht als Finanz-, Anlage-, Handels- oder andere Arten von Ratschlägen oder Empfehlungen gedacht, die von TradingView bereitgestellt oder gebilligt werden, und stellen diese nicht dar. Lesen Sie mehr in den Nutzungsbedingungen.
Verbundene Veröffentlichungen
Haftungsausschluss
Die Informationen und Veröffentlichungen sind nicht als Finanz-, Anlage-, Handels- oder andere Arten von Ratschlägen oder Empfehlungen gedacht, die von TradingView bereitgestellt oder gebilligt werden, und stellen diese nicht dar. Lesen Sie mehr in den Nutzungsbedingungen.