
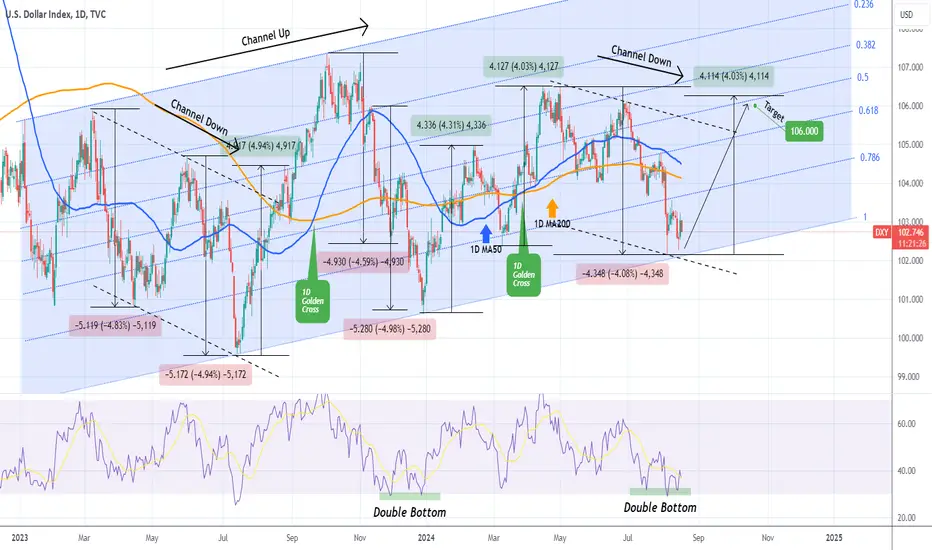
The U.S. Dollar Index (DXY) has been trading within a 19-month Channel Up pattern and this week (as well as on August 05), it almost reached its bottom (Higher Lows trend-line). This is a Double Bottom formation so far, which is a bullish pattern, that was also formed on the 1D RSI.
The last time the RSI completed this formation, we've had a bottom that gave way to a strong Bullish Leg. Most rallies/ declines within this pattern have been between a 4.00% to 5.00% range.
As a result, we turn bullish on DXY now, targeting 106.00, which is just below a potential +4.00% rise and almost on the 0.5 Fibonacci level of the Channel Up.
-------------------------------------------------------------------------------
** Please LIKE 👍, FOLLOW ✅, SHARE 🙌 and COMMENT ✍ if you enjoy this idea! Also share your ideas and charts in the comments section below! This is best way to keep it relevant, support us, keep the content here free and allow the idea to reach as many people as possible. **
-------------------------------------------------------------------------------
💸💸💸💸💸💸
👇 👇 👇 👇 👇 👇
The last time the RSI completed this formation, we've had a bottom that gave way to a strong Bullish Leg. Most rallies/ declines within this pattern have been between a 4.00% to 5.00% range.
As a result, we turn bullish on DXY now, targeting 106.00, which is just below a potential +4.00% rise and almost on the 0.5 Fibonacci level of the Channel Up.
-------------------------------------------------------------------------------
** Please LIKE 👍, FOLLOW ✅, SHARE 🙌 and COMMENT ✍ if you enjoy this idea! Also share your ideas and charts in the comments section below! This is best way to keep it relevant, support us, keep the content here free and allow the idea to reach as many people as possible. **
-------------------------------------------------------------------------------
💸💸💸💸💸💸
👇 👇 👇 👇 👇 👇

I trade Crypto, Forex, Indices & Commodities on PrimeXBT — all from one account with TradingView charts 👉 tradingshot.short.gy/PrimeXBT
I also use TradeNation for fixed spreads & zero commission 👉 tradingshot.short.gy/Tradenation
I also use TradeNation for fixed spreads & zero commission 👉 tradingshot.short.gy/Tradenation
Haftungsausschluss
Die Informationen und Veröffentlichungen sind nicht als Finanz-, Anlage-, Handels- oder andere Arten von Ratschlägen oder Empfehlungen gedacht, die von TradingView bereitgestellt oder gebilligt werden, und stellen diese nicht dar. Lesen Sie mehr in den Nutzungsbedingungen.
I trade Crypto, Forex, Indices & Commodities on PrimeXBT — all from one account with TradingView charts 👉 tradingshot.short.gy/PrimeXBT
I also use TradeNation for fixed spreads & zero commission 👉 tradingshot.short.gy/Tradenation
I also use TradeNation for fixed spreads & zero commission 👉 tradingshot.short.gy/Tradenation
Haftungsausschluss
Die Informationen und Veröffentlichungen sind nicht als Finanz-, Anlage-, Handels- oder andere Arten von Ratschlägen oder Empfehlungen gedacht, die von TradingView bereitgestellt oder gebilligt werden, und stellen diese nicht dar. Lesen Sie mehr in den Nutzungsbedingungen.