
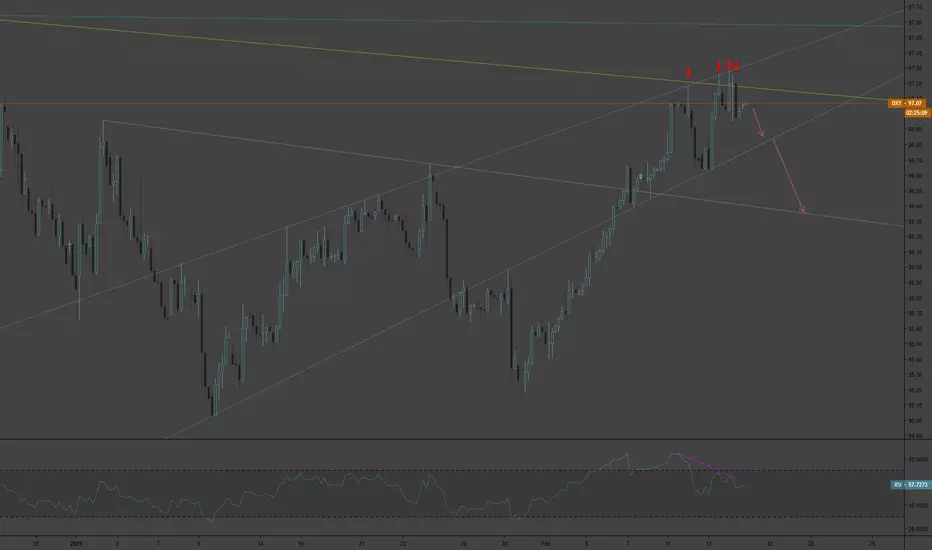
The yellow trendline is drawn from the January 2016 high.
DXY bulls have been rejected a total of four times over the past few sessions, as shown by the red arrows on the chart.
Bearish divergence on the 4 hour chart may indicate bulls are losing momentum, at least in the short term....
Additional trendlines are drawn from recent swing highs / lows and seem to provide strong suppoort / resistance. As long as the price remains below the yellow line, I will remain bearish on the USD.
Gold looks ready to take advantage of any USD weakness after bouncing off channel support to break through trendline resistance. Perhaps a change in risk sentiment.... USDJPY and SPY both look like they're ready to fall.
DXY bulls have been rejected a total of four times over the past few sessions, as shown by the red arrows on the chart.
Bearish divergence on the 4 hour chart may indicate bulls are losing momentum, at least in the short term....
Additional trendlines are drawn from recent swing highs / lows and seem to provide strong suppoort / resistance. As long as the price remains below the yellow line, I will remain bearish on the USD.
Gold looks ready to take advantage of any USD weakness after bouncing off channel support to break through trendline resistance. Perhaps a change in risk sentiment.... USDJPY and SPY both look like they're ready to fall.

Verbundene Veröffentlichungen
Haftungsausschluss
Die Informationen und Veröffentlichungen sind nicht als Finanz-, Anlage-, Handels- oder andere Arten von Ratschlägen oder Empfehlungen gedacht, die von TradingView bereitgestellt oder gebilligt werden, und stellen diese nicht dar. Lesen Sie mehr in den Nutzungsbedingungen.
Verbundene Veröffentlichungen
Haftungsausschluss
Die Informationen und Veröffentlichungen sind nicht als Finanz-, Anlage-, Handels- oder andere Arten von Ratschlägen oder Empfehlungen gedacht, die von TradingView bereitgestellt oder gebilligt werden, und stellen diese nicht dar. Lesen Sie mehr in den Nutzungsbedingungen.