
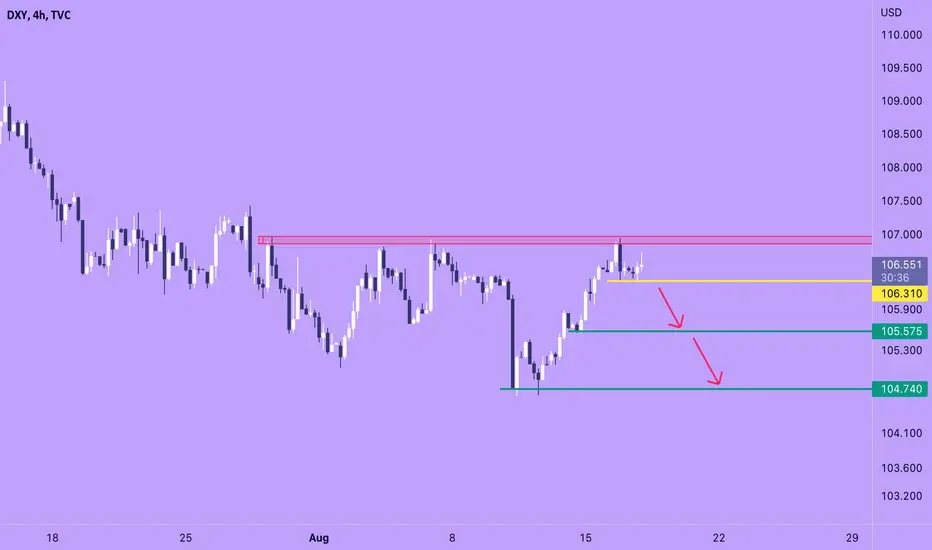
Although US Dollar Index had a good growth last week, it is still in a downtrend.
If we take a look at the price structure, we can see that the number of bearish candles is much less than the bullish ones, which means that the bearish pressure is more than the bullish pressure.
Currently, price has been rejected from the red resistance zone and it seems like it is going to retest it again.
Since we have a strong resistance area ahead and the main trend is bearish, if price breaks the yellow support level at 106.310, I expect a drop on DXY towards the next green support levels at 105.575 and 104.740
If we take a look at the price structure, we can see that the number of bearish candles is much less than the bullish ones, which means that the bearish pressure is more than the bullish pressure.
Currently, price has been rejected from the red resistance zone and it seems like it is going to retest it again.
Since we have a strong resistance area ahead and the main trend is bearish, if price breaks the yellow support level at 106.310, I expect a drop on DXY towards the next green support levels at 105.575 and 104.740

Haftungsausschluss
Die Informationen und Veröffentlichungen sind nicht als Finanz-, Anlage-, Handels- oder andere Arten von Ratschlägen oder Empfehlungen gedacht, die von TradingView bereitgestellt oder gebilligt werden, und stellen diese nicht dar. Lesen Sie mehr in den Nutzungsbedingungen.
Haftungsausschluss
Die Informationen und Veröffentlichungen sind nicht als Finanz-, Anlage-, Handels- oder andere Arten von Ratschlägen oder Empfehlungen gedacht, die von TradingView bereitgestellt oder gebilligt werden, und stellen diese nicht dar. Lesen Sie mehr in den Nutzungsbedingungen.