
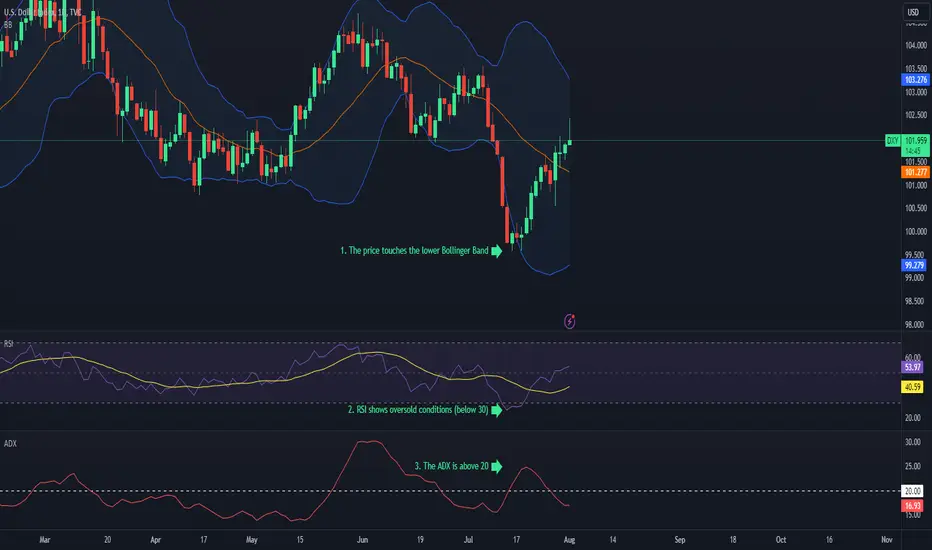
"Super Swing Strategy" - Bollinger Bands, RSI, and ADX Strategy
Indicators Used:
- Bollinger Bands
- Relative Strength Index (RSI)
- Average Directional Index (ADX)
Bollinger Bands for volatility, RSI for overbought and oversold conditions, and ADX for strength of the trend.
How it Works:
Add Bollinger Bands, a 14-period RSI, and a 14-period ADX to your chart.
When the price touches the upper Bollinger Band, the RSI shows overbought conditions (above 70), and the ADX is above 20, it's a potential bearish signal.
A bullish signal occurs when the price touches the lower Bollinger Band, the RSI shows oversold conditions (below 30), and the ADX is above 20.
You can use additional indicators or price action analysis to confirm signals.
Indicators Used:
- Bollinger Bands
- Relative Strength Index (RSI)
- Average Directional Index (ADX)
Bollinger Bands for volatility, RSI for overbought and oversold conditions, and ADX for strength of the trend.
How it Works:
Add Bollinger Bands, a 14-period RSI, and a 14-period ADX to your chart.
When the price touches the upper Bollinger Band, the RSI shows overbought conditions (above 70), and the ADX is above 20, it's a potential bearish signal.
A bullish signal occurs when the price touches the lower Bollinger Band, the RSI shows oversold conditions (below 30), and the ADX is above 20.
You can use additional indicators or price action analysis to confirm signals.

Haftungsausschluss
Die Informationen und Veröffentlichungen sind nicht als Finanz-, Anlage-, Handels- oder andere Arten von Ratschlägen oder Empfehlungen gedacht, die von TradingView bereitgestellt oder gebilligt werden, und stellen diese nicht dar. Lesen Sie mehr in den Nutzungsbedingungen.
Haftungsausschluss
Die Informationen und Veröffentlichungen sind nicht als Finanz-, Anlage-, Handels- oder andere Arten von Ratschlägen oder Empfehlungen gedacht, die von TradingView bereitgestellt oder gebilligt werden, und stellen diese nicht dar. Lesen Sie mehr in den Nutzungsbedingungen.