
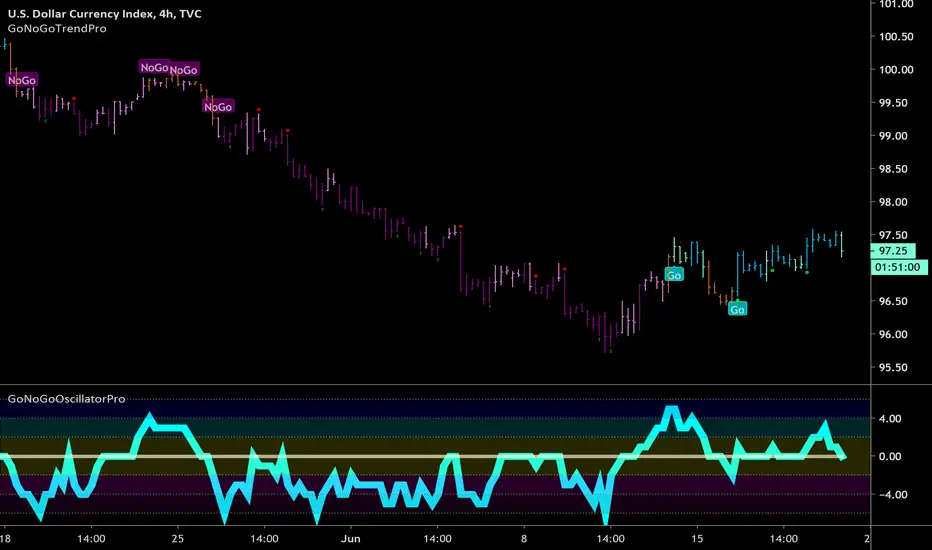
Yesterday we looked at the Euro. Today let’s look at the dollar index. The GoNoGo chart of DXY looks like the EURUSD chart flipped upside down. This makes sense as the EUR is the largest component in this basket.
After a strong trend down since mid May with several advantageous low risk entries (red dots) we were first informed of the threat to the down trend on the 11th of June when the GoNoGo Oscillator was able to break above zero in to positive territory.
The GoNoGo Trend followed this by recognizing the trend change and flagging a “Go”. The trend is a “Go” with the GoNoGo Oscillator testing support at the zero line. If this holds, expect further rally in price.
What are the GoNoGo Indicators?
The GoNoGo Trend indicator blends traditional trend concepts to color price action according to the strength of its trend. The colors range from bright blue (strongly bullish) to dark purple (strongly bearish)
The GoNoGo Oscillator blends traditional momentum concepts to demonstrate the velocity of price action. The oscillator ranges from -6 (extremely oversold) to +6 (extremely overbought)
After a strong trend down since mid May with several advantageous low risk entries (red dots) we were first informed of the threat to the down trend on the 11th of June when the GoNoGo Oscillator was able to break above zero in to positive territory.
The GoNoGo Trend followed this by recognizing the trend change and flagging a “Go”. The trend is a “Go” with the GoNoGo Oscillator testing support at the zero line. If this holds, expect further rally in price.
What are the GoNoGo Indicators?
The GoNoGo Trend indicator blends traditional trend concepts to color price action according to the strength of its trend. The colors range from bright blue (strongly bullish) to dark purple (strongly bearish)
The GoNoGo Oscillator blends traditional momentum concepts to demonstrate the velocity of price action. The oscillator ranges from -6 (extremely oversold) to +6 (extremely overbought)

Verbundene Veröffentlichungen
Haftungsausschluss
Die Informationen und Veröffentlichungen sind nicht als Finanz-, Anlage-, Handels- oder andere Arten von Ratschlägen oder Empfehlungen gedacht, die von TradingView bereitgestellt oder gebilligt werden, und stellen diese nicht dar. Lesen Sie mehr in den Nutzungsbedingungen.
Verbundene Veröffentlichungen
Haftungsausschluss
Die Informationen und Veröffentlichungen sind nicht als Finanz-, Anlage-, Handels- oder andere Arten von Ratschlägen oder Empfehlungen gedacht, die von TradingView bereitgestellt oder gebilligt werden, und stellen diese nicht dar. Lesen Sie mehr in den Nutzungsbedingungen.