
Hello Crypto Lovers,
Mars Signals team wishes you high profits.
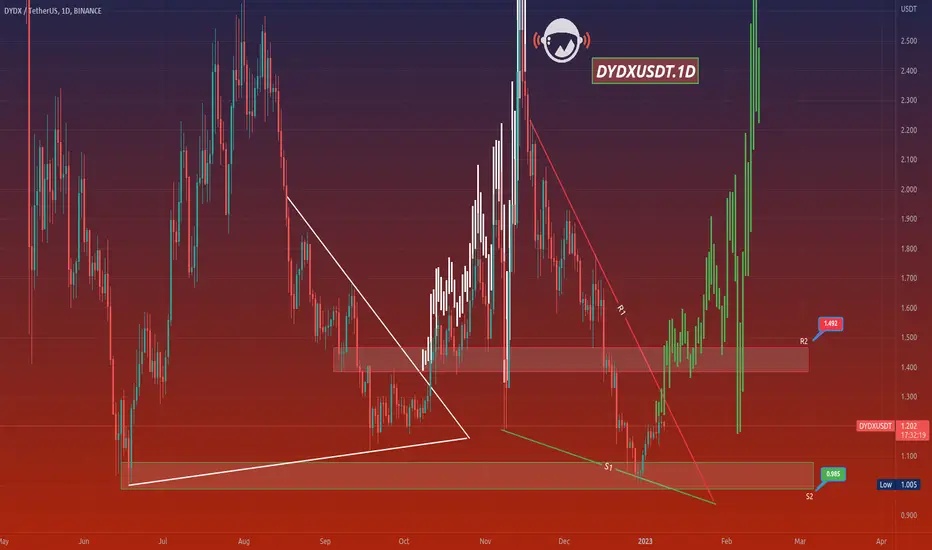
This is a one-day-time frame analysis for DYDXUSDT
In this chart, R1 is our resistance area in which the unsuccessful triumphs of price is obvious. R2 used to be a support area. And S1 and S2 are the support areas that contain the well support of price at various points. Presently, we observe the fluctuation of price below R1 after a recovery trend and our expectation would include a rise to move over this area toward R2; as it used to behave in its past trend which is seen by the white lines in a rising trend. Then there would be more rise via some rising signs and surely the price would face a rise up to higher amounts above R2. Or it happens that the price would not be supported and starts a decline downward. Please bear in mind that you need multiple pieces of information which you would obtain from our updates and analyses.
Warning: This is just a suggestion and we do not guarantee profits. We advise you to analyze the chart before opening any positions.
Wish you luck

Haftungsausschluss
Die Informationen und Veröffentlichungen sind nicht als Finanz-, Anlage-, Handels- oder andere Arten von Ratschlägen oder Empfehlungen gedacht, die von TradingView bereitgestellt oder gebilligt werden, und stellen diese nicht dar. Lesen Sie mehr in den Nutzungsbedingungen.
Haftungsausschluss
Die Informationen und Veröffentlichungen sind nicht als Finanz-, Anlage-, Handels- oder andere Arten von Ratschlägen oder Empfehlungen gedacht, die von TradingView bereitgestellt oder gebilligt werden, und stellen diese nicht dar. Lesen Sie mehr in den Nutzungsbedingungen.