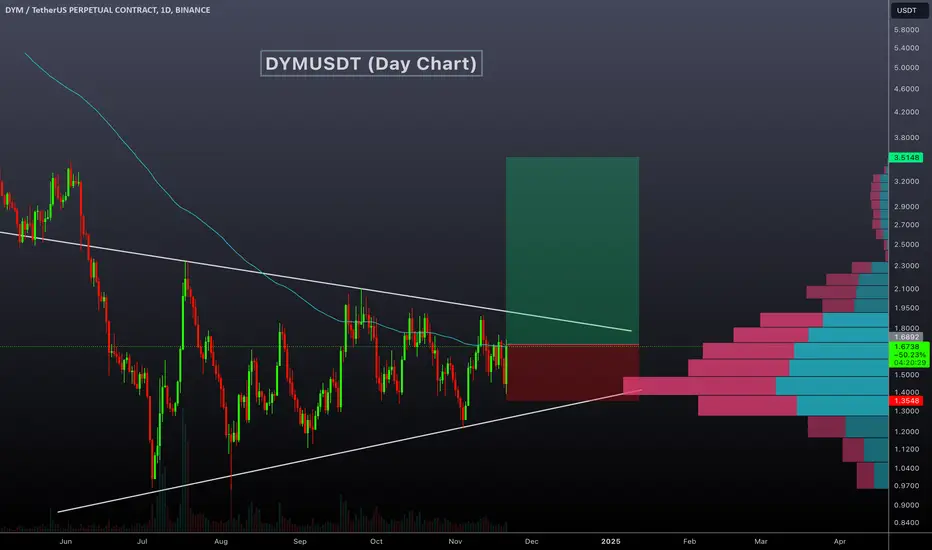
DYMUSDT Technical analysis update
DYMUSDT has been trading within a triangle formation for the past 165 days. The price is now moving towards the triangle's resistance level, potentially signaling a breakout. The profile volume indicates strong support at $1.40, and the price has crossed above the 100 EMA on the daily chart. A strong bullish move can be expected from the current level.
Buy zone : Below $1.70
Stop loss : $1.37
Take Profit 1: $1.97
Take Profit 2: $2.47
Take Profit 3: $3.45
Trade ist aktiv

 DYMUSDT TP 1 hit
20%+ profit

🚀Telegram : t.me/hexatrades
🌐Website: hexatrades.io/
🗣️Twitter(X): twitter.com/HexaTrades
🌐Website: hexatrades.io/
🗣️Twitter(X): twitter.com/HexaTrades
Verbundene Veröffentlichungen
Haftungsausschluss
Die Informationen und Veröffentlichungen sind nicht als Finanz-, Anlage-, Handels- oder andere Arten von Ratschlägen oder Empfehlungen gedacht, die von TradingView bereitgestellt oder gebilligt werden, und stellen diese nicht dar. Lesen Sie mehr in den Nutzungsbedingungen.