
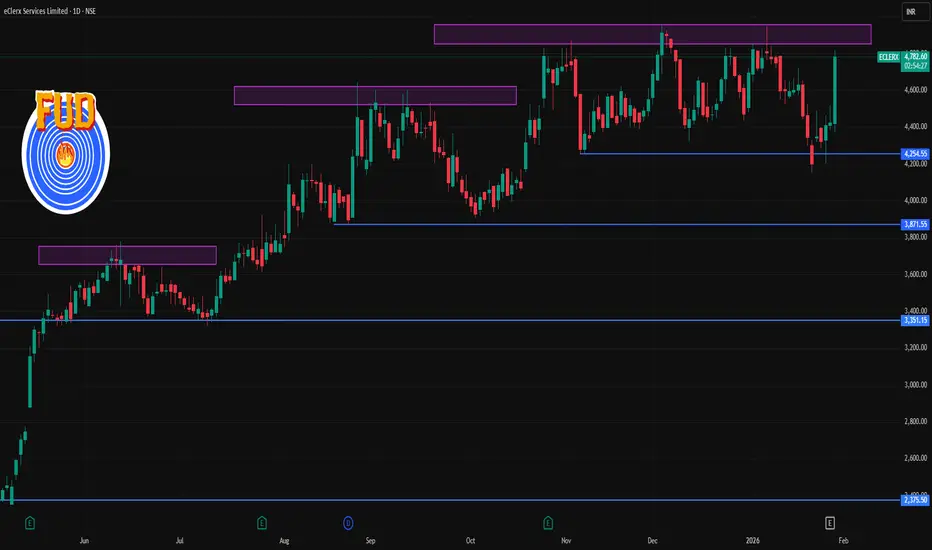
📍 Current Price Snapshot (Daily)
As of the latest available trading data:
• ECLERX daily price: ~₹4,710–₹4,740 region (intraday update) — fluctuating with bullish momentum near recent highs.
📊 Daily Technical Levels (Key Support & Resistance)
Classic Pivot Levels (Daily)
Based on recent pivot calculations from multiple technical sources:
Resistance
R3: ~₹4,748
R2: ~₹4,710–₹4,687
R1: ~₹4,626–₹4,649
Pivot Point: ~₹4,649
Support
S1: ~₹4,588–₹4,588
S2: ~₹4,561–₹4,611
S3: ~₹4,565 and lower
(values approximate based on classic & fibonacci pivot methods)
Simplified pivot zone (short)
Resistance Zone: ~₹4,710–₹4,750
Support Zone: ~₹4,560–₹4,590
Major pivot: ~₹4,648 (neutral decision level)
Additional Support / Resistance Levels (Alternate Sources)
From trendlyne / pivot screens:
• First Resistance: ~₹4,386–₹4,451
• Second Resistance: ~₹4,550–₹4,555
• Third Resistance: ~₹4,621–₹4,622
• Support Zones: ~₹4,254–₹4,215 and deeper ~₹4,161–₹4,111 if broader pullbacks occur.
👉 These can be useful as secondary trigger levels if price action tests below pivot or breaks above immediate resistance.
📌 How to Use These Levels Today
Bullish bias
➡ A daily close above ₹4,710–₹4,750 resistance cluster suggests continuation toward recent highs (potential next zone in higher time frames).
Bearish/Correction risk
➡ Weak price action below ₹4,590–₹4,560 support on the daily can expose the next support band around ₹4,500–₹4,450.
Key pivot confirmation
➡ The central range around ₹4,640–₹4,650 serves as a daily pivot — sustained trading above supports bullish control, below introduces caution.
As of the latest available trading data:
• ECLERX daily price: ~₹4,710–₹4,740 region (intraday update) — fluctuating with bullish momentum near recent highs.
📊 Daily Technical Levels (Key Support & Resistance)
Classic Pivot Levels (Daily)
Based on recent pivot calculations from multiple technical sources:
Resistance
R3: ~₹4,748
R2: ~₹4,710–₹4,687
R1: ~₹4,626–₹4,649
Pivot Point: ~₹4,649
Support
S1: ~₹4,588–₹4,588
S2: ~₹4,561–₹4,611
S3: ~₹4,565 and lower
(values approximate based on classic & fibonacci pivot methods)
Simplified pivot zone (short)
Resistance Zone: ~₹4,710–₹4,750
Support Zone: ~₹4,560–₹4,590
Major pivot: ~₹4,648 (neutral decision level)
Additional Support / Resistance Levels (Alternate Sources)
From trendlyne / pivot screens:
• First Resistance: ~₹4,386–₹4,451
• Second Resistance: ~₹4,550–₹4,555
• Third Resistance: ~₹4,621–₹4,622
• Support Zones: ~₹4,254–₹4,215 and deeper ~₹4,161–₹4,111 if broader pullbacks occur.
👉 These can be useful as secondary trigger levels if price action tests below pivot or breaks above immediate resistance.
📌 How to Use These Levels Today
Bullish bias
➡ A daily close above ₹4,710–₹4,750 resistance cluster suggests continuation toward recent highs (potential next zone in higher time frames).
Bearish/Correction risk
➡ Weak price action below ₹4,590–₹4,560 support on the daily can expose the next support band around ₹4,500–₹4,450.
Key pivot confirmation
➡ The central range around ₹4,640–₹4,650 serves as a daily pivot — sustained trading above supports bullish control, below introduces caution.

Contact Knowledgehub for a detailed consultation: Dm on WhatsApp: [wa.link/a2o0kz]-
Phone No: [+91 93102 26243]-
Email: [tradingviewknowledgehub@gmail.com]---
-- Let’s achieve success together!
Phone No: [+91 93102 26243]-
Email: [tradingviewknowledgehub@gmail.com]---
-- Let’s achieve success together!
Verbundene Veröffentlichungen
Haftungsausschluss
Die Informationen und Veröffentlichungen sind nicht als Finanz-, Anlage-, Handels- oder andere Arten von Ratschlägen oder Empfehlungen gedacht, die von TradingView bereitgestellt oder gebilligt werden, und stellen diese nicht dar. Lesen Sie mehr in den Nutzungsbedingungen.
Contact Knowledgehub for a detailed consultation: Dm on WhatsApp: [wa.link/a2o0kz]-
Phone No: [+91 93102 26243]-
Email: [tradingviewknowledgehub@gmail.com]---
-- Let’s achieve success together!
Phone No: [+91 93102 26243]-
Email: [tradingviewknowledgehub@gmail.com]---
-- Let’s achieve success together!
Verbundene Veröffentlichungen
Haftungsausschluss
Die Informationen und Veröffentlichungen sind nicht als Finanz-, Anlage-, Handels- oder andere Arten von Ratschlägen oder Empfehlungen gedacht, die von TradingView bereitgestellt oder gebilligt werden, und stellen diese nicht dar. Lesen Sie mehr in den Nutzungsbedingungen.