Long
EMC2 Post pump, possible continuation.
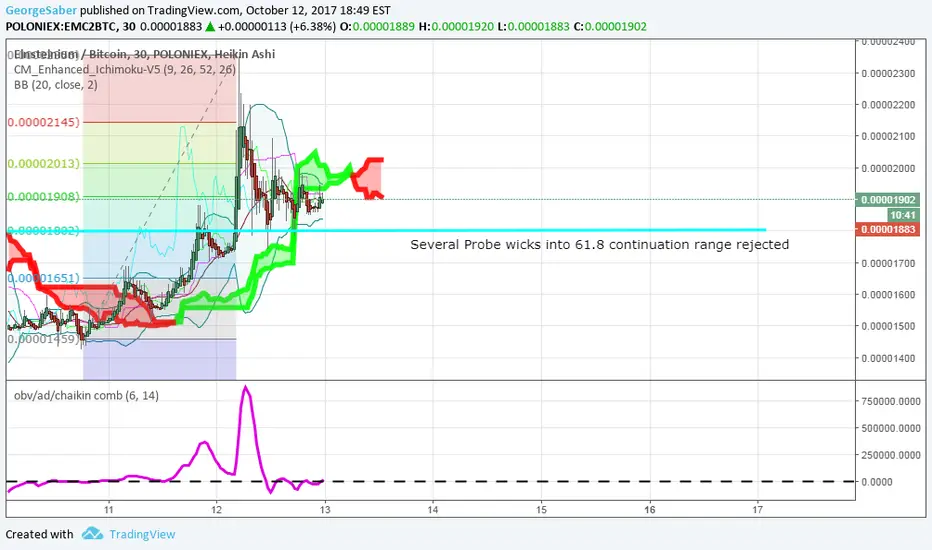
Last night's unexpected pump left EMC2 trading above 61.8 fib, continuation level;
Several probe wicks into 61.8 where rejected and eaten up.
I entered this trade just now, hoping for a continuation.
Chart appears to be at a volatile level, with Bollinger Bands tightening on the 30min time frame.
2hour chart shows all candles closing above red OBV chart; hence Bullish.
Yesterday's pump showed massive bullish wicks, and volume on bittrex is at 1700
OBV showing reduced selling/distribution.
I'm in and long; tell me if I'm wrong.

Haftungsausschluss
Die Informationen und Veröffentlichungen sind nicht als Finanz-, Anlage-, Handels- oder andere Arten von Ratschlägen oder Empfehlungen gedacht, die von TradingView bereitgestellt oder gebilligt werden, und stellen diese nicht dar. Lesen Sie mehr in den Nutzungsbedingungen.
Haftungsausschluss
Die Informationen und Veröffentlichungen sind nicht als Finanz-, Anlage-, Handels- oder andere Arten von Ratschlägen oder Empfehlungen gedacht, die von TradingView bereitgestellt oder gebilligt werden, und stellen diese nicht dar. Lesen Sie mehr in den Nutzungsbedingungen.