Long
EOS
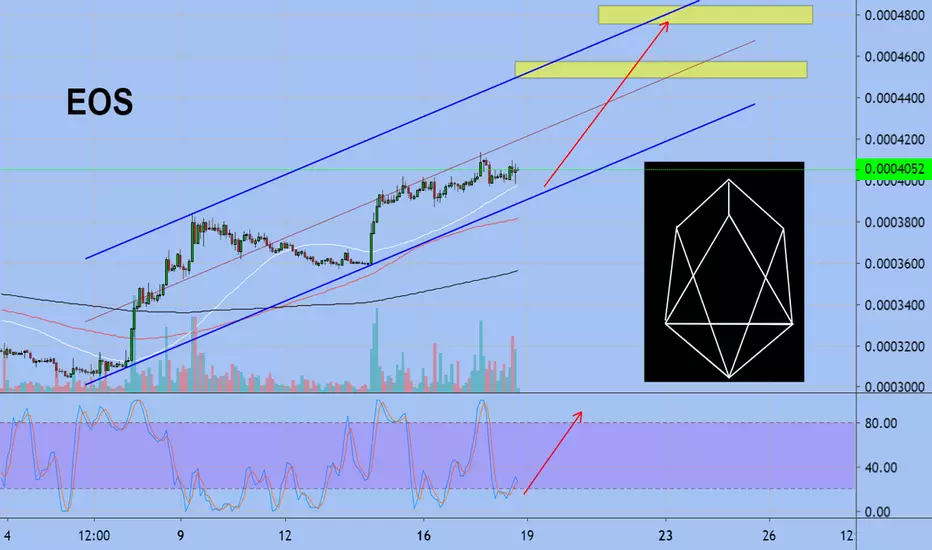
In Weekly chart we formed falling wedge and we still inside this pattern, so first we need reach resistance line at price around 0.0004800

In daily chart we can see down trend channel. We touched support line of channel and moving to midle line at 0.0004500 area also at this price we can see MA100

In small time frames we can see how we going in uptrend channel and now we below midle line of this channel. We can test again support line and go to resistance line of this channel
In daily chart we can see down trend channel. We touched support line of channel and moving to midle line at 0.0004500 area also at this price we can see MA100
In small time frames we can see how we going in uptrend channel and now we below midle line of this channel. We can test again support line and go to resistance line of this channel
Trade geschlossen: Stop wurde erreicht
Stop loss
Show your skill pnl.world/auth?ref=90144806
Crypto ex bitunix.com/register?vipCode=Ri1J7239
Portfolio excavo.com/stocks
Tg t.me/excavo
t.me/EXCAVOREFF_bot
trading-tournaments.com/
Crypto ex bitunix.com/register?vipCode=Ri1J7239
Portfolio excavo.com/stocks
Tg t.me/excavo
t.me/EXCAVOREFF_bot
trading-tournaments.com/
Verbundene Veröffentlichungen
Haftungsausschluss
Die Informationen und Veröffentlichungen sind nicht als Finanz-, Anlage-, Handels- oder andere Arten von Ratschlägen oder Empfehlungen gedacht, die von TradingView bereitgestellt oder gebilligt werden, und stellen diese nicht dar. Lesen Sie mehr in den Nutzungsbedingungen.