
I haven't seen a chart like this.
Overbought conditions tend to go to extremely high levels. ( RSI<30 oversold & RSI>70 overbought).
Technical Analysis:
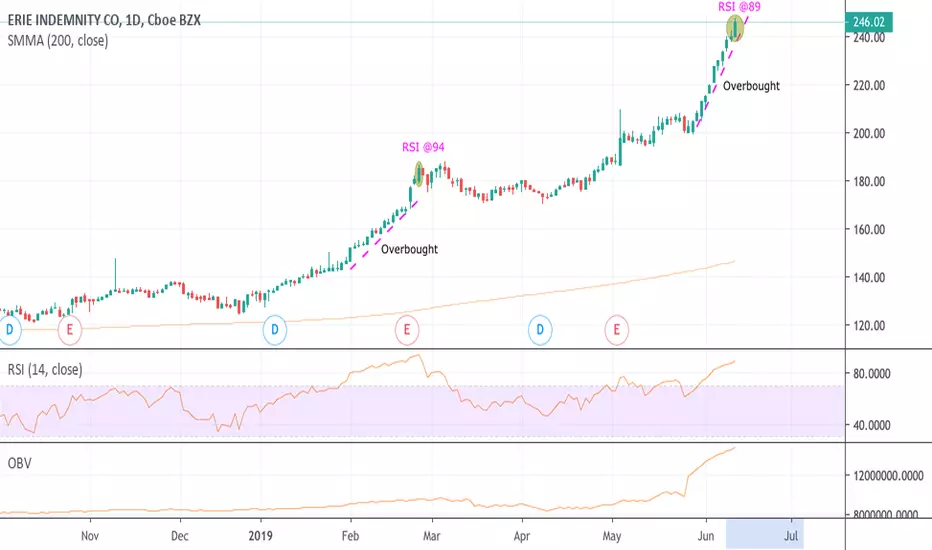
I see a positive divergence between the bull rally from February (marked in the chart) and this June bull rally, is that the OBV is 50% higher!
RSI(10) 89, last rally ended on RSI(10) @94.
Check out the chart for more information.
Overbought conditions tend to go to extremely high levels. ( RSI<30 oversold & RSI>70 overbought).
Technical Analysis:
I see a positive divergence between the bull rally from February (marked in the chart) and this June bull rally, is that the OBV is 50% higher!
RSI(10) 89, last rally ended on RSI(10) @94.
Check out the chart for more information.

Haftungsausschluss
Die Informationen und Veröffentlichungen sind nicht als Finanz-, Anlage-, Handels- oder andere Arten von Ratschlägen oder Empfehlungen gedacht, die von TradingView bereitgestellt oder gebilligt werden, und stellen diese nicht dar. Lesen Sie mehr in den Nutzungsbedingungen.
Haftungsausschluss
Die Informationen und Veröffentlichungen sind nicht als Finanz-, Anlage-, Handels- oder andere Arten von Ratschlägen oder Empfehlungen gedacht, die von TradingView bereitgestellt oder gebilligt werden, und stellen diese nicht dar. Lesen Sie mehr in den Nutzungsbedingungen.