
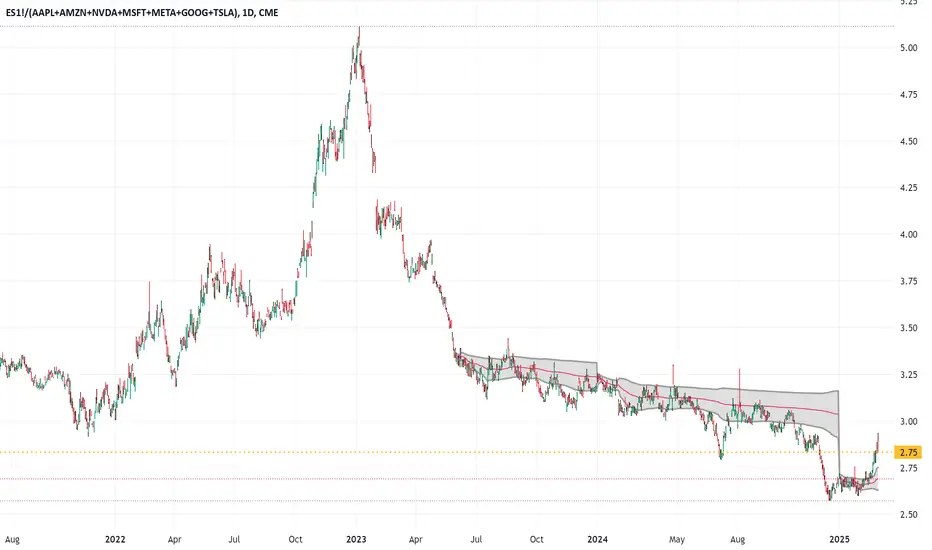
Here is we can observe the broadening out of the stock concentration we have observed for the past 4 years in the Mag7 which at its peak reached 35% of the market.
To read this chart correctly.
1: This is ES/Mag 7 relative strength. It is full ES 500- MAG 7- Apple, Amazon, Google, Meta, Microsoft, Nividia Tesla.
2. When this chart goes up, it means concentration is broadening out i.e more investment into more of the SP500 other/ smaller companies and less into Mag 7.
2.1 When this chart goes Down, it ca signify A: Heavy selling in Mag 7 companies. OR B: Heavy buying in the broader set of S&P500 companies. OR Both at the same time.
To read this chart correctly.
1: This is ES/Mag 7 relative strength. It is full ES 500- MAG 7- Apple, Amazon, Google, Meta, Microsoft, Nividia Tesla.
2. When this chart goes up, it means concentration is broadening out i.e more investment into more of the SP500 other/ smaller companies and less into Mag 7.
2.1 When this chart goes Down, it ca signify A: Heavy selling in Mag 7 companies. OR B: Heavy buying in the broader set of S&P500 companies. OR Both at the same time.

Trading is waiting
Haftungsausschluss
Die Informationen und Veröffentlichungen sind nicht als Finanz-, Anlage-, Handels- oder andere Arten von Ratschlägen oder Empfehlungen gedacht, die von TradingView bereitgestellt oder gebilligt werden, und stellen diese nicht dar. Lesen Sie mehr in den Nutzungsbedingungen.
Trading is waiting
Haftungsausschluss
Die Informationen und Veröffentlichungen sind nicht als Finanz-, Anlage-, Handels- oder andere Arten von Ratschlägen oder Empfehlungen gedacht, die von TradingView bereitgestellt oder gebilligt werden, und stellen diese nicht dar. Lesen Sie mehr in den Nutzungsbedingungen.