
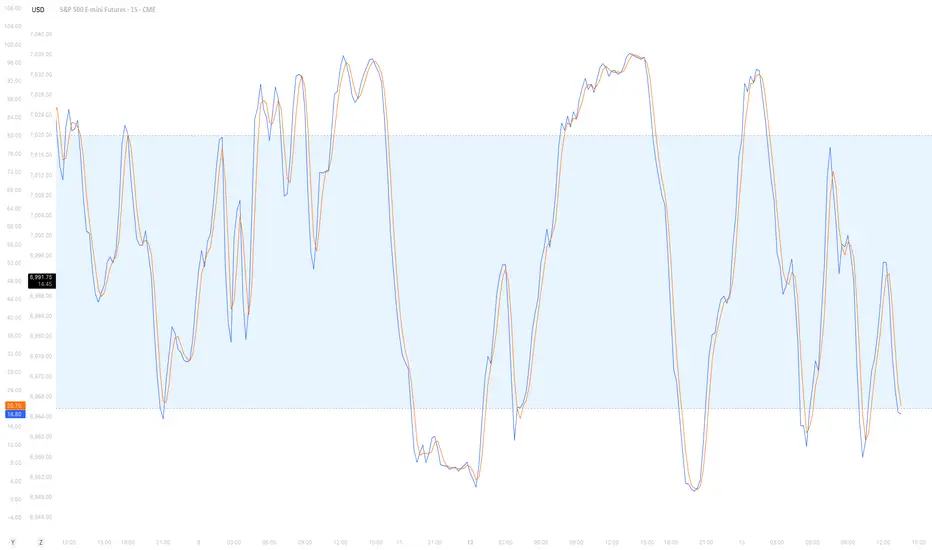
The Stochastic Oscillator is one of the most widely used momentum indicators in technical analysis. It helps traders identify potential trend reversals, overbought and oversold conditions, and momentum shifts before price reacts.

Unlike trend-following indicators, Stochastic focuses on price momentum, making it especially useful in ranging or consolidating markets.
What Is the Stochastic Oscillator?
The Stochastic Oscillator compares the current closing price to the price range (high–low) over a selected lookback period.
Core concept: Momentum changes direction before price does.
When price is closing near the top of its recent range, momentum is strong. When it closes near the bottom, momentum is weakening.
The indicator consists of two lines:
These two lines oscillate between 0 and 100.
Stochastic Oscillator Formula
%K = (Current Close − Lowest Low) / (Highest High − Lowest Low) × 100
Where:
This calculation shows where the current close sits relative to recent price extremes.
Default TradingView Settings
TradingView’s default Stochastic settings are:
These values are balanced for most markets and timeframes. Shorter periods make the indicator more responsive, while longer periods reduce noise but increase lag.
How to Read the Stochastic Oscillator
The Stochastic Oscillator always moves between 0 and 100.
Important:
Overbought does not mean price must fall, and oversold does not mean price must rise. In strong trends, price can remain overbought or oversold for extended periods.
Common Trading Strategies
1. Overbought & Oversold Reversal Strategy

This is the most common use of the Stochastic Oscillator and works best in sideways or ranging markets.
2. Trend-Based Stochastic Strategy

In trending markets, Stochastic should be used as a confirmation tool rather than a reversal signal.
This approach helps traders stay aligned with the dominant trend.
3. Stochastic Divergence

Divergence occurs when price and the indicator move in opposite directions.
Divergence often signals weakening momentum and potential trend reversal.
Best Timeframes for Stochastic Oscillator
The Stochastic Oscillator can be applied to any timeframe, but signal quality generally improves on higher timeframes.
Lower timeframes generate more signals but also more false signals.
Advantages and Disadvantages
Advantages
Disadvantages
Final Thoughts
The Stochastic Oscillator is a powerful momentum indicator when used correctly. It performs best when combined with:
Always use confirmation and proper risk management before entering trades.
Trade smart and stay disciplined 📈
Unlike trend-following indicators, Stochastic focuses on price momentum, making it especially useful in ranging or consolidating markets.
What Is the Stochastic Oscillator?
The Stochastic Oscillator compares the current closing price to the price range (high–low) over a selected lookback period.
Core concept: Momentum changes direction before price does.
When price is closing near the top of its recent range, momentum is strong. When it closes near the bottom, momentum is weakening.
The indicator consists of two lines:
- %K – The main momentum line (fast)
- %D – A smoothed moving average of %K (signal line)
These two lines oscillate between 0 and 100.
Stochastic Oscillator Formula
%K = (Current Close − Lowest Low) / (Highest High − Lowest Low) × 100
Where:
- Lowest Low = Lowest price over the lookback period
- Highest High = Highest price over the lookback period
This calculation shows where the current close sits relative to recent price extremes.
Default TradingView Settings
TradingView’s default Stochastic settings are:
- %K Length: 14
- %K Smoothing: 1
- %D Length: 3
- Overbought Level: 80
- Oversold Level: 20
These values are balanced for most markets and timeframes. Shorter periods make the indicator more responsive, while longer periods reduce noise but increase lag.
How to Read the Stochastic Oscillator
The Stochastic Oscillator always moves between 0 and 100.
- Above 80 → Market is considered overbought
- Below 20 → Market is considered oversold
- %K crossing above %D → Bullish momentum shift
- %K crossing below %D → Bearish momentum shift
Important:
Overbought does not mean price must fall, and oversold does not mean price must rise. In strong trends, price can remain overbought or oversold for extended periods.
Common Trading Strategies
1. Overbought & Oversold Reversal Strategy
This is the most common use of the Stochastic Oscillator and works best in sideways or ranging markets.
- Buy when %K crosses above %D below the 20 level
- Sell when %K crosses below %D above the 80 level
2. Trend-Based Stochastic Strategy
In trending markets, Stochastic should be used as a confirmation tool rather than a reversal signal.
- Uptrend: Look for oversold signals only
- Downtrend: Look for overbought signals only
This approach helps traders stay aligned with the dominant trend.
3. Stochastic Divergence
Divergence occurs when price and the indicator move in opposite directions.
- Bullish divergence: Price makes lower lows while Stochastic makes higher lows
- Bearish divergence: Price makes higher highs while Stochastic makes lower highs
Divergence often signals weakening momentum and potential trend reversal.
Best Timeframes for Stochastic Oscillator
The Stochastic Oscillator can be applied to any timeframe, but signal quality generally improves on higher timeframes.
- Scalping: 1m – 5m
- Day Trading: 15m – 1h
- Swing Trading: 4h – 1D
Lower timeframes generate more signals but also more false signals.
Advantages and Disadvantages
Advantages
- Simple and easy to interpret
- Effective for spotting momentum shifts
- Works well in range-bound markets
Disadvantages
- Prone to false signals in strong trends
- Can lag during sharp price movements
- Should be combined with other tools
Final Thoughts
The Stochastic Oscillator is a powerful momentum indicator when used correctly. It performs best when combined with:
- Trend indicators such as moving averages or VWAP
- Support and resistance levels
- Price action and market structure
Always use confirmation and proper risk management before entering trades.
Trade smart and stay disciplined 📈

🔵 Tools that give you the edge: candelacharts.com/.
🔵 Join our free discord for updates: candelacharts.com/community
🔵 Join our free discord for updates: candelacharts.com/community
Haftungsausschluss
Die Informationen und Veröffentlichungen sind nicht als Finanz-, Anlage-, Handels- oder andere Arten von Ratschlägen oder Empfehlungen gedacht, die von TradingView bereitgestellt oder gebilligt werden, und stellen diese nicht dar. Lesen Sie mehr in den Nutzungsbedingungen.
🔵 Tools that give you the edge: candelacharts.com/.
🔵 Join our free discord for updates: candelacharts.com/community
🔵 Join our free discord for updates: candelacharts.com/community
Haftungsausschluss
Die Informationen und Veröffentlichungen sind nicht als Finanz-, Anlage-, Handels- oder andere Arten von Ratschlägen oder Empfehlungen gedacht, die von TradingView bereitgestellt oder gebilligt werden, und stellen diese nicht dar. Lesen Sie mehr in den Nutzungsbedingungen.