
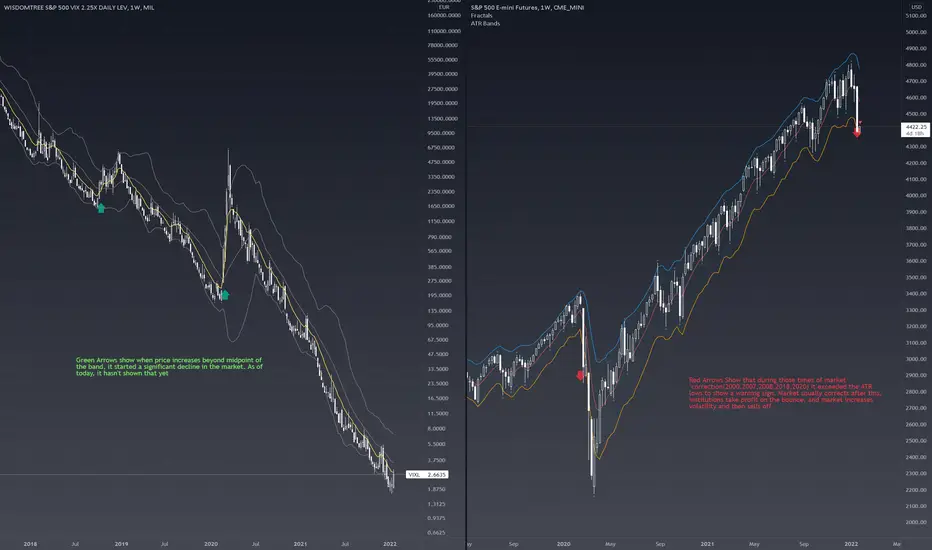
Green Arrows show when price increases beyond midpoint of the band, it started a significant decline in the market. As of today, it hasn't shown that yet
Red Arrows Show that during those times of market "correction(2000,2007,2008,2018,2020) it exceeded the ATR lows to show a warning sign. Market usually corrects after this, institutions take profit on the bounce, and market increases volatility and then sells off.
Red Arrows Show that during those times of market "correction(2000,2007,2008,2018,2020) it exceeded the ATR lows to show a warning sign. Market usually corrects after this, institutions take profit on the bounce, and market increases volatility and then sells off.

Haftungsausschluss
Die Informationen und Veröffentlichungen sind nicht als Finanz-, Anlage-, Handels- oder andere Arten von Ratschlägen oder Empfehlungen gedacht, die von TradingView bereitgestellt oder gebilligt werden, und stellen diese nicht dar. Lesen Sie mehr in den Nutzungsbedingungen.
Haftungsausschluss
Die Informationen und Veröffentlichungen sind nicht als Finanz-, Anlage-, Handels- oder andere Arten von Ratschlägen oder Empfehlungen gedacht, die von TradingView bereitgestellt oder gebilligt werden, und stellen diese nicht dar. Lesen Sie mehr in den Nutzungsbedingungen.