Short
Bearish Symmetric Triangle Inbound!!
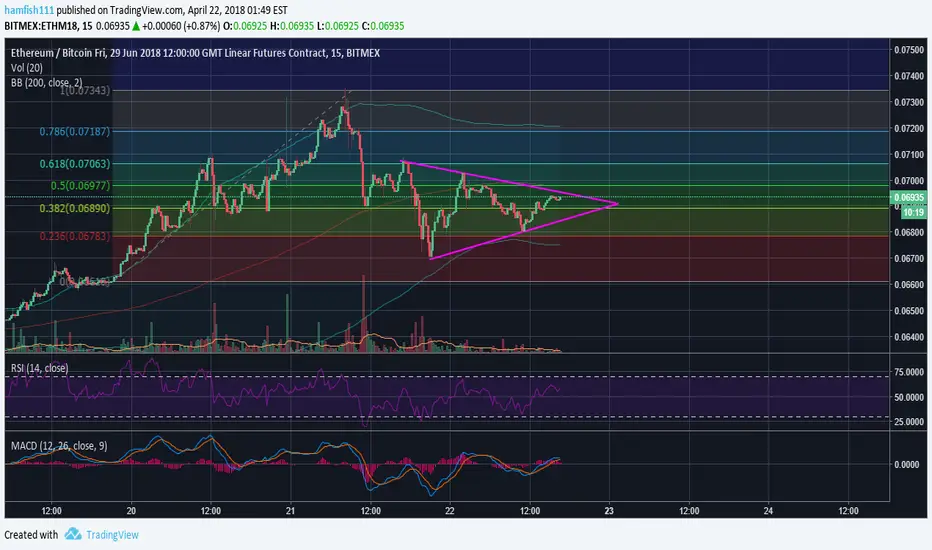
Looking at Ethereum you can see a very noticeable bearish symmetric triangle, some people may get this mixed up with a pennant but the difference between the two is that with a bearish triangle, the price starts from the high point, whereas a pennant starts from the low point.
And also looking at the MACD a crossover seems very possible to the bearish side, and the RSI looks to form a head and shoulders pattern which is also a bearish signal.
Thanks, if you liked my idea dont forget to like it and follow me for more ideas!
And also looking at the MACD a crossover seems very possible to the bearish side, and the RSI looks to form a head and shoulders pattern which is also a bearish signal.
Thanks, if you liked my idea dont forget to like it and follow me for more ideas!
Anmerkung
i dont even understand
Haftungsausschluss
Die Informationen und Veröffentlichungen sind nicht als Finanz-, Anlage-, Handels- oder andere Arten von Ratschlägen oder Empfehlungen gedacht, die von TradingView bereitgestellt oder gebilligt werden, und stellen diese nicht dar. Lesen Sie mehr in den Nutzungsbedingungen.
Haftungsausschluss
Die Informationen und Veröffentlichungen sind nicht als Finanz-, Anlage-, Handels- oder andere Arten von Ratschlägen oder Empfehlungen gedacht, die von TradingView bereitgestellt oder gebilligt werden, und stellen diese nicht dar. Lesen Sie mehr in den Nutzungsbedingungen.