
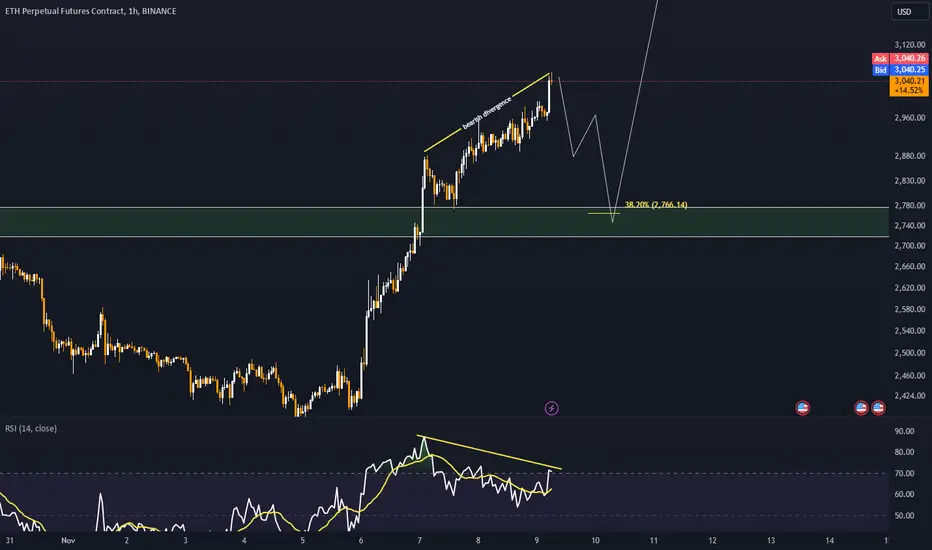
Ethereum is currently displaying signs of a bearish divergence on lower timeframes, a signal that often indicates a potential slowdown in upward momentum and the likelihood of a correction. Despite the bearish signal, the ongoing correction appears to be relatively shallow, suggesting that the underlying bullish structure remains intact.
A retracement to the 0.382 Fibonacci level could present an attractive buying opportunity for traders looking to enter at a lower risk point. This level is often viewed as a key zone for price reactions during corrections, providing a favorable balance between value and momentum for long-term positions.
A retracement to the 0.382 Fibonacci level could present an attractive buying opportunity for traders looking to enter at a lower risk point. This level is often viewed as a key zone for price reactions during corrections, providing a favorable balance between value and momentum for long-term positions.

Haftungsausschluss
Die Informationen und Veröffentlichungen sind nicht als Finanz-, Anlage-, Handels- oder andere Arten von Ratschlägen oder Empfehlungen gedacht, die von TradingView bereitgestellt oder gebilligt werden, und stellen diese nicht dar. Lesen Sie mehr in den Nutzungsbedingungen.
Haftungsausschluss
Die Informationen und Veröffentlichungen sind nicht als Finanz-, Anlage-, Handels- oder andere Arten von Ratschlägen oder Empfehlungen gedacht, die von TradingView bereitgestellt oder gebilligt werden, und stellen diese nicht dar. Lesen Sie mehr in den Nutzungsbedingungen.