
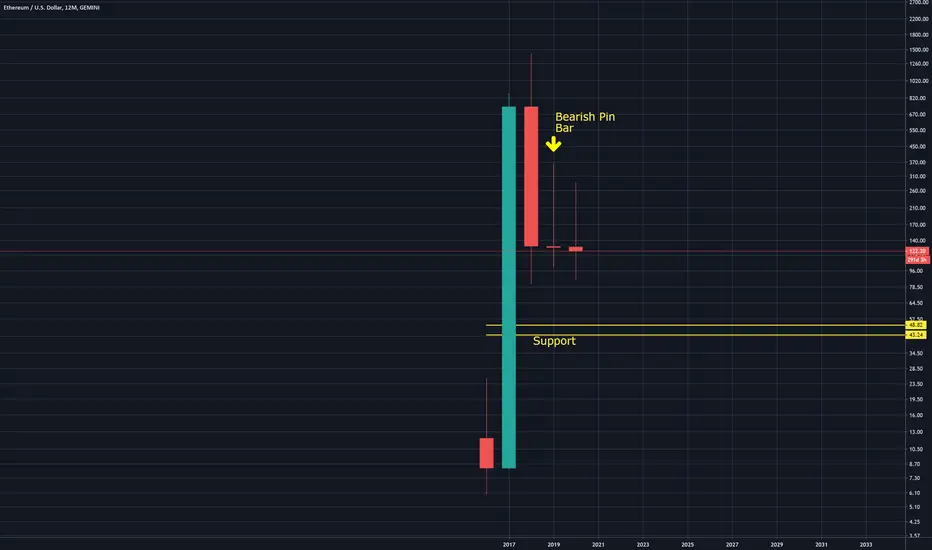
I believe this yearly chart shows the worst case scenario facing ETH holders, which involves price decisively breaking down from the bearish pinbar that formed on the yearly candle in 2019. If this pattern plays out then the next major support doesn't come into play until around $40-50. That is about 40-50% lower than the lowest price that was hit in the epic selloff last week, and about 65-70% lower than current prices. Hitting this low does not effectively change the long term perspective of Ethereum in my opinion, but would make for an absolutely brutal bear market for everyone.

Haftungsausschluss
Die Informationen und Veröffentlichungen sind nicht als Finanz-, Anlage-, Handels- oder andere Arten von Ratschlägen oder Empfehlungen gedacht, die von TradingView bereitgestellt oder gebilligt werden, und stellen diese nicht dar. Lesen Sie mehr in den Nutzungsbedingungen.
Haftungsausschluss
Die Informationen und Veröffentlichungen sind nicht als Finanz-, Anlage-, Handels- oder andere Arten von Ratschlägen oder Empfehlungen gedacht, die von TradingView bereitgestellt oder gebilligt werden, und stellen diese nicht dar. Lesen Sie mehr in den Nutzungsbedingungen.