
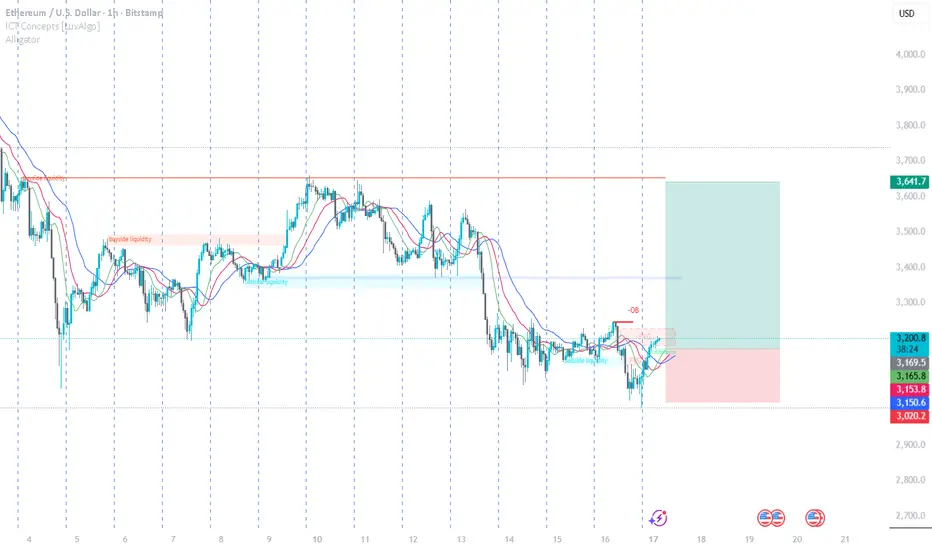
1H Reversal → Now Looking for Expansion**
ETH just confirmed a clean shift from reversal into continuation, exactly the structure we expect after clearing liquidity and tapping a fresh demand zone.
1️⃣ Liquidity Grab Completed
Price swept sell-side liquidity beneath the recent range (classic ICT sell-to-buy behavior).
Smart money filled long positions → bullish narrative begins.
2️⃣ Breaker + FVG Retest
ETH returned to a micro Breaker Block + a small 1H FVG.
These zones overlap—confluence for continuation.
Price is now sitting right inside that region.
3️⃣ Alligator Compression (Bill Williams)
Alligator (blue-red-green) lines are compressing.
This is the “sleeping Alligator” phase → volatility contraction.
What comes next?
Expansion.
Direction of expansion = aligned with the higher-timeframe liquidity draw above.
4️⃣ Clear Draw on Liquidity Above
Closest upside magnets:
3,300 – 3,330 → inefficiency fill
3,641.7 → major liquidity + previous 1H distribution high
The model favors a move up to rebalance those imbalances.
My Trade Setup (1H Long)
Entry Zone:
🔵 3,160 – 3,200 (Breaker + FVG confluence)
Stop Loss:
🔻 3,020
(below last displacement low — invalidation)
Targets:
🎯 TP1: 3,300
🎯 TP2: 3,420 – mid-range imbalance
🎯 TP3: 3,641.7 (main liquidity draw)
Risk-to-Reward:
Solid continuation R:R from current structure
(as shown on the chart).

Haftungsausschluss
Die Informationen und Veröffentlichungen sind nicht als Finanz-, Anlage-, Handels- oder andere Arten von Ratschlägen oder Empfehlungen gedacht, die von TradingView bereitgestellt oder gebilligt werden, und stellen diese nicht dar. Lesen Sie mehr in den Nutzungsbedingungen.
Haftungsausschluss
Die Informationen und Veröffentlichungen sind nicht als Finanz-, Anlage-, Handels- oder andere Arten von Ratschlägen oder Empfehlungen gedacht, die von TradingView bereitgestellt oder gebilligt werden, und stellen diese nicht dar. Lesen Sie mehr in den Nutzungsbedingungen.