
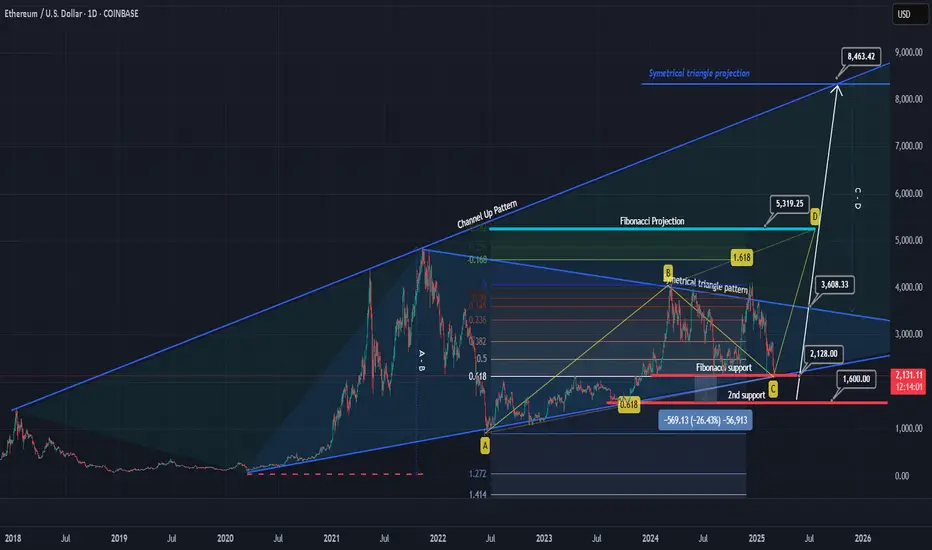
This analysis builds upon the previous technical outlook, identifying three key patterns on Ethereum’s daily timeframe:
1. Ascending Channel
Ethereum has been trading within a well-established ascending channel since 2018. Each time a new all-time high (ATH) is reached, price consistently tests the channel’s resistance, while the major support level was formed on March 23, 2020, creating a strong demand zone that remains intact.
Currently, ETH has reached the lower boundary of this channel at $2,128, a key support level. If a bullish reversal occurs, the next upside target aligns with the ascending channel resistance at $8,463.
2. Symmetrical Triangle
A symmetrical triangle pattern has been forming since March 23, 2020, with its support level coinciding with the lower boundary of the ascending channel. A confirmed breakout above $3,600 would validate this pattern, triggering a bullish AB=CD extension, with a price projection towards $8,463.
3. Fibonacci Retracement
Currently, ETH is testing the 0.618 Fibonacci retracement level, a critical zone for potential trend reversals. If this level holds against bearish pressure, the next bullish projection aligns with the 1.618 Fibonacci extension at $5,319.
Breakdown Risk & Buyback Strategy
If the current support level fails, ETH could see a maximum downside correction of -26%, targeting $1,600. This level presents a high-probability buyback opportunity, offering a potential +437% upside, should Ethereum rally towards its extended price projection at $8,463.
This analysis underscores the importance of risk management and technical confirmation signals before executing any trades.
1. Ascending Channel
Ethereum has been trading within a well-established ascending channel since 2018. Each time a new all-time high (ATH) is reached, price consistently tests the channel’s resistance, while the major support level was formed on March 23, 2020, creating a strong demand zone that remains intact.
Currently, ETH has reached the lower boundary of this channel at $2,128, a key support level. If a bullish reversal occurs, the next upside target aligns with the ascending channel resistance at $8,463.
2. Symmetrical Triangle
A symmetrical triangle pattern has been forming since March 23, 2020, with its support level coinciding with the lower boundary of the ascending channel. A confirmed breakout above $3,600 would validate this pattern, triggering a bullish AB=CD extension, with a price projection towards $8,463.
3. Fibonacci Retracement
Currently, ETH is testing the 0.618 Fibonacci retracement level, a critical zone for potential trend reversals. If this level holds against bearish pressure, the next bullish projection aligns with the 1.618 Fibonacci extension at $5,319.
Breakdown Risk & Buyback Strategy
If the current support level fails, ETH could see a maximum downside correction of -26%, targeting $1,600. This level presents a high-probability buyback opportunity, offering a potential +437% upside, should Ethereum rally towards its extended price projection at $8,463.
This analysis underscores the importance of risk management and technical confirmation signals before executing any trades.

🚨 LIVE 28-Pair Forex Trend & Reversal Scanner + Alerts
youtube.com/@rendraAzrulsyah
📊 Technical Analysis Class: 1 SPOT ONLY
🎁 FREE all Forex & Crypto Indicators for 1 YEAR
DM to join.
youtube.com/@rendraAzrulsyah
📊 Technical Analysis Class: 1 SPOT ONLY
🎁 FREE all Forex & Crypto Indicators for 1 YEAR
DM to join.
Haftungsausschluss
Die Informationen und Veröffentlichungen sind nicht als Finanz-, Anlage-, Handels- oder andere Arten von Ratschlägen oder Empfehlungen gedacht, die von TradingView bereitgestellt oder gebilligt werden, und stellen diese nicht dar. Lesen Sie mehr in den Nutzungsbedingungen.
🚨 LIVE 28-Pair Forex Trend & Reversal Scanner + Alerts
youtube.com/@rendraAzrulsyah
📊 Technical Analysis Class: 1 SPOT ONLY
🎁 FREE all Forex & Crypto Indicators for 1 YEAR
DM to join.
youtube.com/@rendraAzrulsyah
📊 Technical Analysis Class: 1 SPOT ONLY
🎁 FREE all Forex & Crypto Indicators for 1 YEAR
DM to join.
Haftungsausschluss
Die Informationen und Veröffentlichungen sind nicht als Finanz-, Anlage-, Handels- oder andere Arten von Ratschlägen oder Empfehlungen gedacht, die von TradingView bereitgestellt oder gebilligt werden, und stellen diese nicht dar. Lesen Sie mehr in den Nutzungsbedingungen.